
The 4 most common reasons the numbers in your Full Service report may not be adding up correctly.
There are several reasons the numbers in your Full Service report may not be adding up to what you think they should be. This article will discuss a few of the most common reasons.
The first and most common reason is that there are Victims or Clients that have been added to the software that have not had any services applied to their cases. In order to be included in the statistical reporting EVERY Victim or Client must have at least one service applied in their Notes and Services screen within the date range of the Full Service report you are generating.
In other words, if you enter 9 new Victims or Clients in December but you only apply services to 6 of those new Victims or Clients your Full Service report will show 6. The other 3 will not be included until at least 1 service is applied to their Notes and Services screen.
If you are adding Children, for example, to a Domestic Violence case each child will need to have at least 1 service applied to their Notes and Services screen to be included in the statistical reporting.
The best way to check for missing services (or any missing statistical data) that will negatively impact your grant reporting is to generate the Missing Data Report. The Missing Data Report is found in the Reports, Classic Reports, Primary section. For more information about generating the Missing Data Report please see the article for that report.
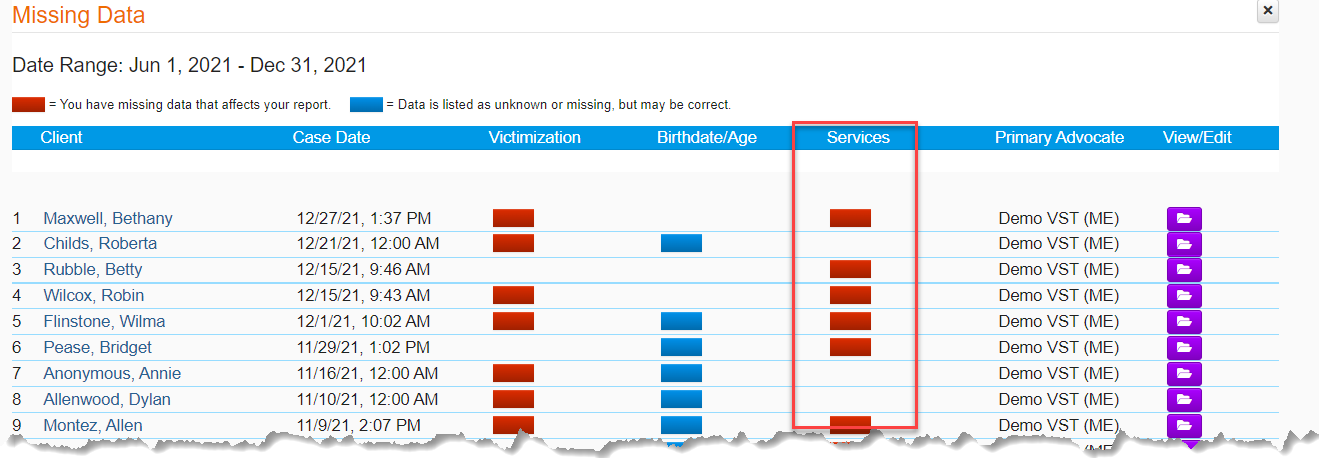
In the example above there are nine new victims/clients that have been entered. Of those nine, three of them do not have services applied and therefore will not be included in the statistical Full Service report.
To fix this information for an accurate Full Service report, click on the person’s name on the left, or the file folder icon on the right. This will take you into their Client Screens where you can review the case and then add the services needed.
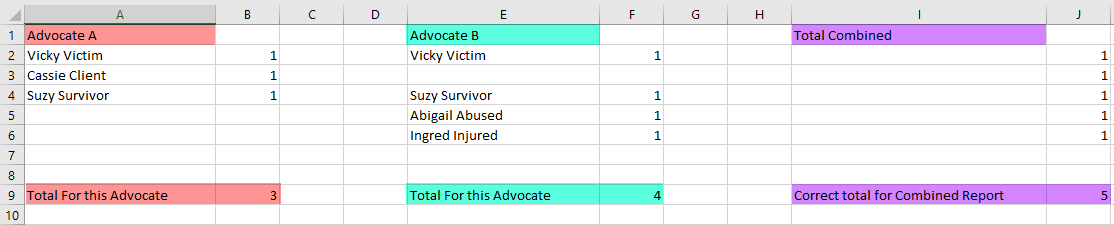
Another common reason the numbers may not be adding up is if you are running individual Advocate reports and adding them up to compare to a report with all Advocates included. The reason for this ‘discrepancy’ is that if you have a Victim or Client, we’ll call her Vicky Victim, that has been provided services by 2 different Advocates in the office and you generate a report for Advocate A; Vicky Victim will be counted as a Victim served by Advocate A. Likewise, if you generate a report for Advocate B Vicky Victim will be counted as a Victim served by Advocate B. However, if you generate a report for both Advocates together Vicky will be counted only 1 time (not once for each Advocate). Vicky is still just 1 person with 1 case, so she is counted just 1 time. Adding Advocate A’s report to Advocate B’s report will NOT equal the total of a report that includes BOTH Advocates together. See the image below to better show this explanation.
The same will hold true if you are generating a separate report for Grants, Agencies, and any other item that can have multiples involved with, or assigned to Victims or Clients.
A third common reason for the numbers to not add up correctly is found in the Race and Gender section of the Full Service reports.
If a Victim or Client is added with a certain Race, or Gender and then a new case is added for that same person with a different Race or Gender it will cause the demographic section of the Full Service reports to be off.
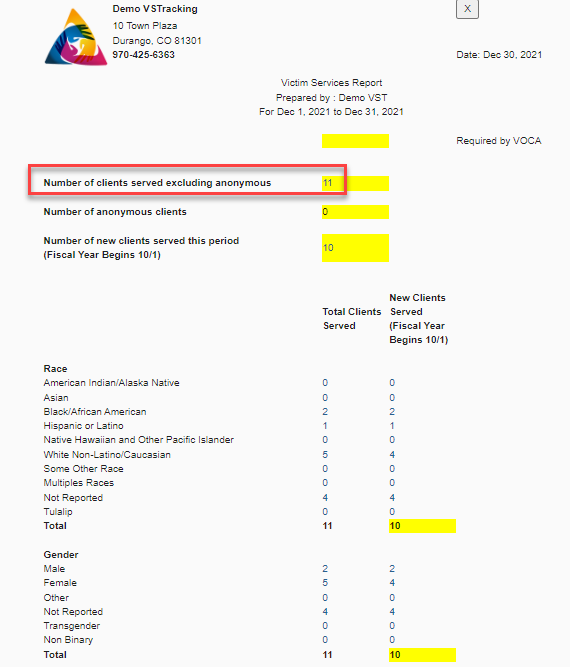
For example, if you enter Vicky Victim as a new Victim or Client in a Domestic Violence case and show her Race to be Unknown or Not Reported and a week later you add a brand-new case for Vicky Victim as the Victim of Robbery and show her Race to be White/Caucasian/Non-Latino (without changing the Race in the first case) the Full Service report will count both Races even though she is just 1 person with multiple cases. You will notice this when you generate the Full Service reports and manually add the Race and Gender sections. It will not add up to the total shown in the report for those sections. See the image below for an example.
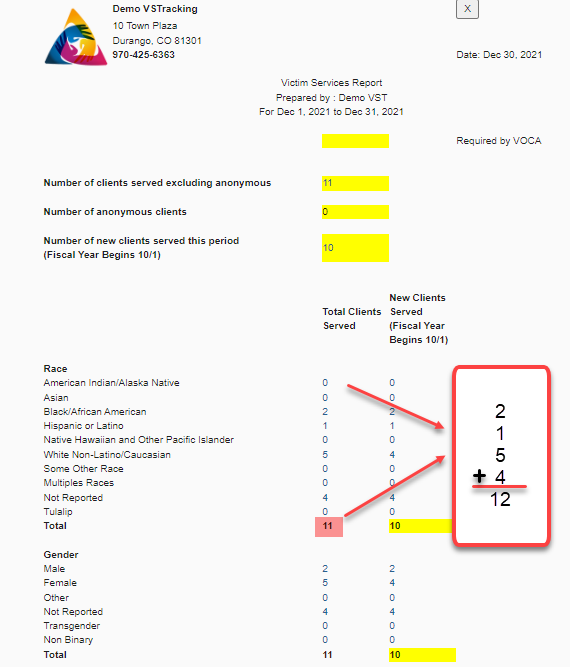
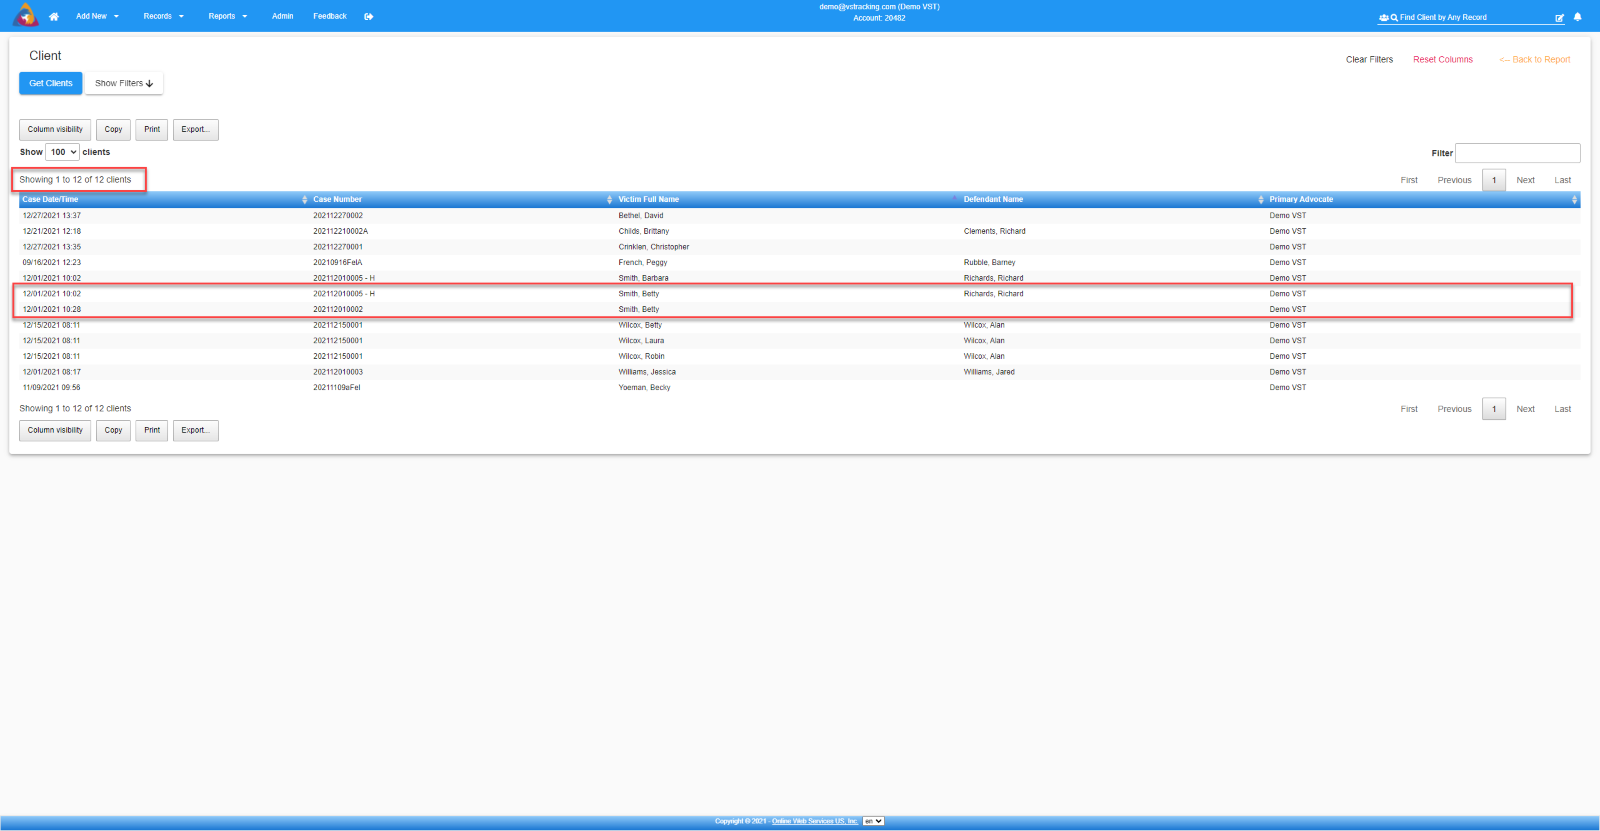
The easiest way to find where the number is off is to click on the number of Victims or Clients in this report (in this example I clicked on the 11 at the top of the report). This will give you a Client List report of those people.
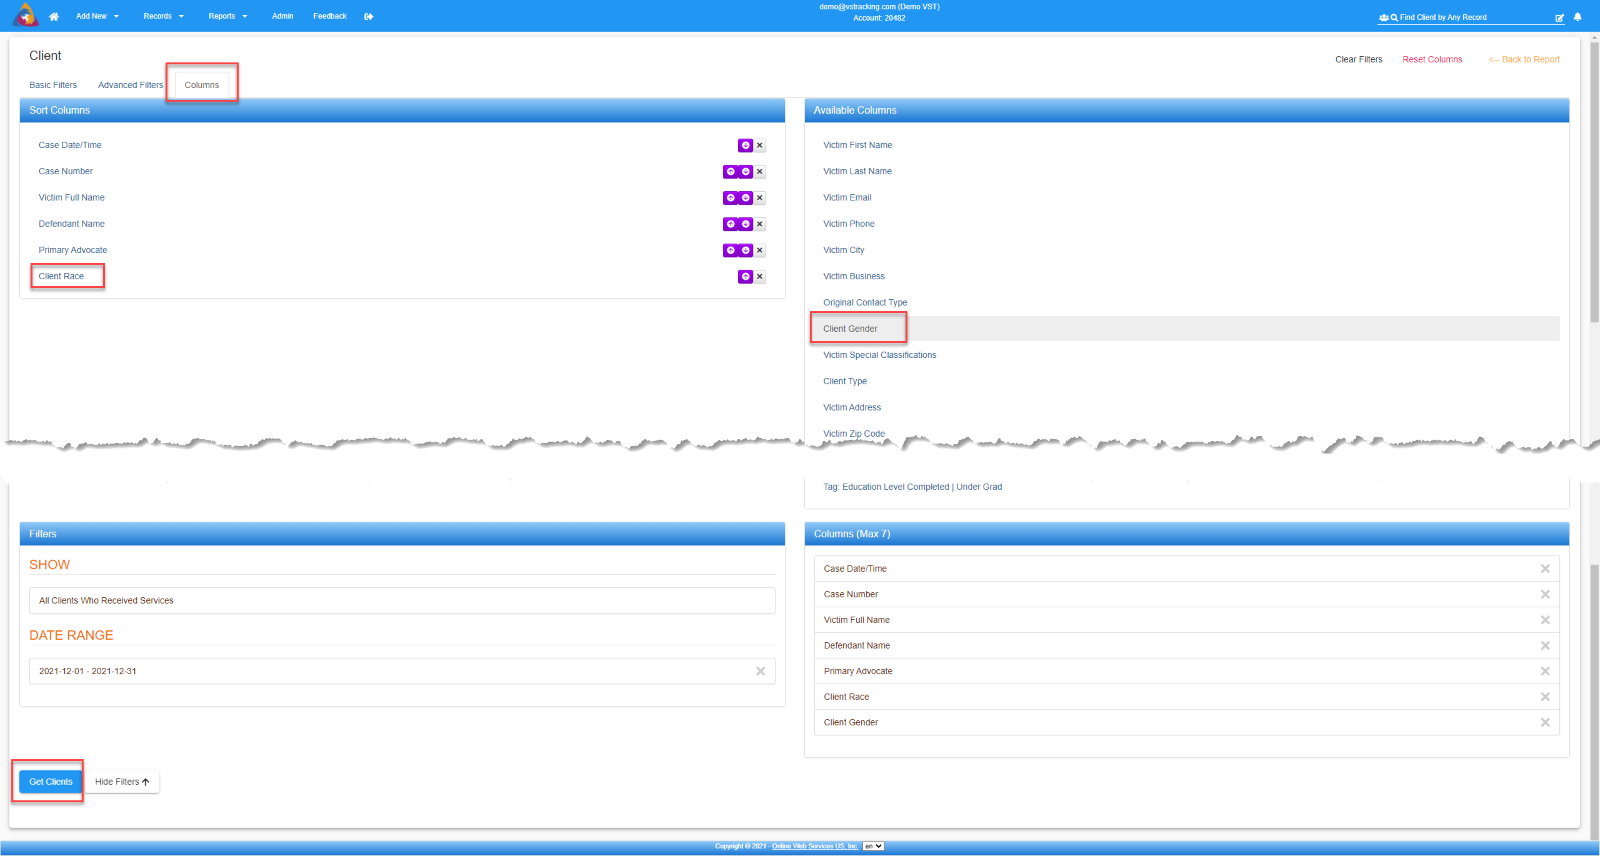
Next click on Show Filters.
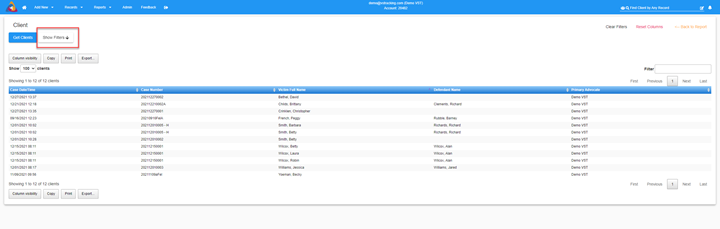
In the Columns Tab choose the Client Race and Client Gender columns to add to the report. Then scroll to the bottom and click Get Clients. **Please note that you may need to remove a column such as Defendant in order to get all the columns you need in your report. There is a limit of 7 columns.
Next, click on the Column Header for Victim Full Name to sort the report and you can see the Victims or Clients that have more than 1 case and what Race and Gender are associated with each case.
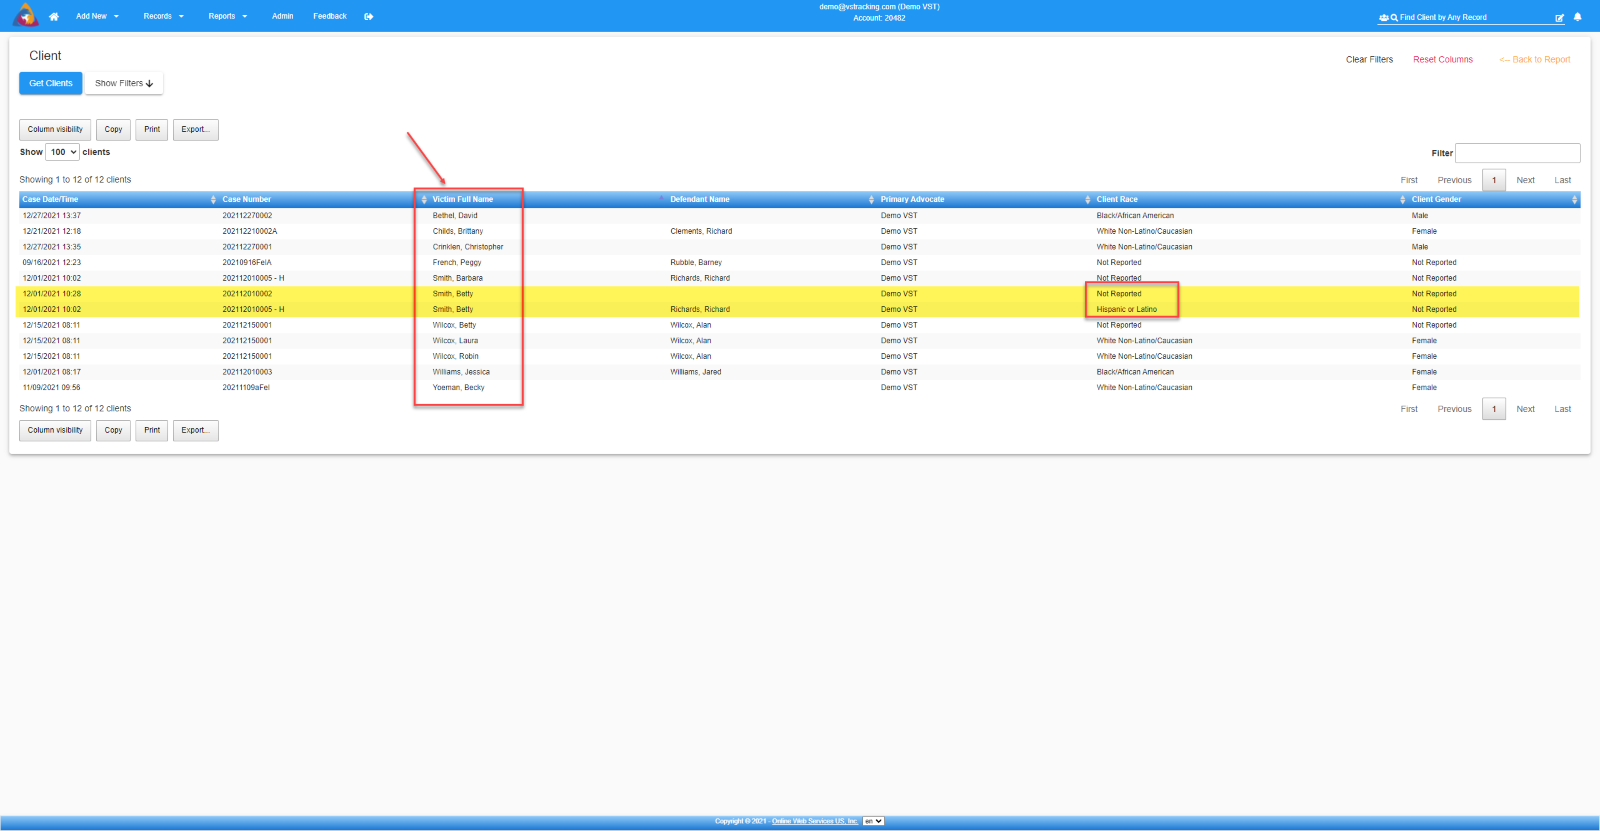
Now you can click on the name, in the list, of the one that you want to edit and correct. Once corrected the numbers in the Full Service report will add up correctly.
***Please note -If you click on a number in the Classic Full Service report and the Client List report that you see from that number does not match, the number in the Classic Full Service report is the UNDUPLICATED number of Victims or Clients reported in that reporting period based on the Fiscal Year set in the Admin screen. The list of clients that you see will be all the clients with all the cases they are involved in (duplicated clients).
According to VOCA and the majority of the other major grants available you can only count a person (Victim or Client) 1 time in the Fiscal Year, regardless of how many victimizations / incidents they are involved in. So, if Vicky Victim is the Victim of Adult Physical Assault in January and then the Victim of DUI in March Vicky’s demographic information will only be counted 1 time. The victimizations and services will all be counted (for each case) accordingly but her Age, Race, and Gender will only be counted 1 time.
The number in the Full Service report reflects the UNDUPLICATED Victim counts for reporting to the grant. When you click on the number it will show you the Client List report with that unduplicated count but it will display each Victim or Client with each case they are involved in (duplicated clients).
A Fourth Common Reason your numbers might not be adding up or making sense has to do with the Grants, Advocates, and Agencies options.
There is no requirement in VSTracking to have a grant, advocate, or agency applied to a victim/client's case, however, this can cause some issues with the reporting when using filters to get very specific reporting.
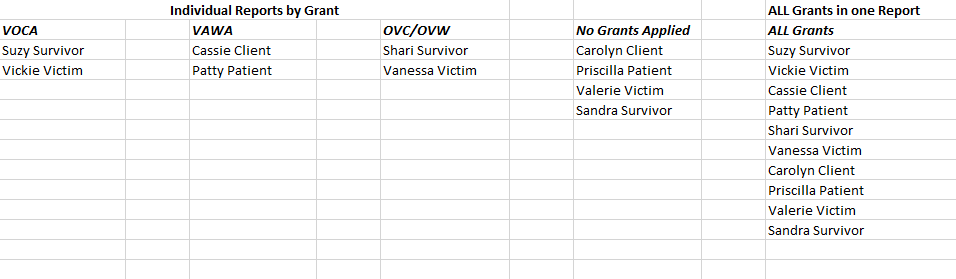
For example, if you were to enter ten victim/clients into VSTracking and two of them have the VOCA grant, two of them have the VAWA grant, two of them have the OVC/OVW grant and the last four have no grants applied, running the report for each separate grant will include the victim/clients with those grants applied and nothing else.
So VOCA would show 2 victim/clients, VAWA would show 2 victim/clients and OVC/OVW would show 2 victim/clients. That's a total of 6 victim/clients if you add them together.
But if you generate the report for ALL grants combined it will show 10 victim/clients. This number will include the four that didn't have grants applied to them.
Example of reporting based on Grant/All Grants
The same will be true if you are trying to generate Advocate, or Agency specific reporting and combined reporting for all.
If you believe this could be the reason your reports are not working, you can confirm by generating the All grants (Advocate, or Agency) report and click on the total number of individuals see the image below:
Image of the Classic Full Service report


Image of the Dynamic Full Service report
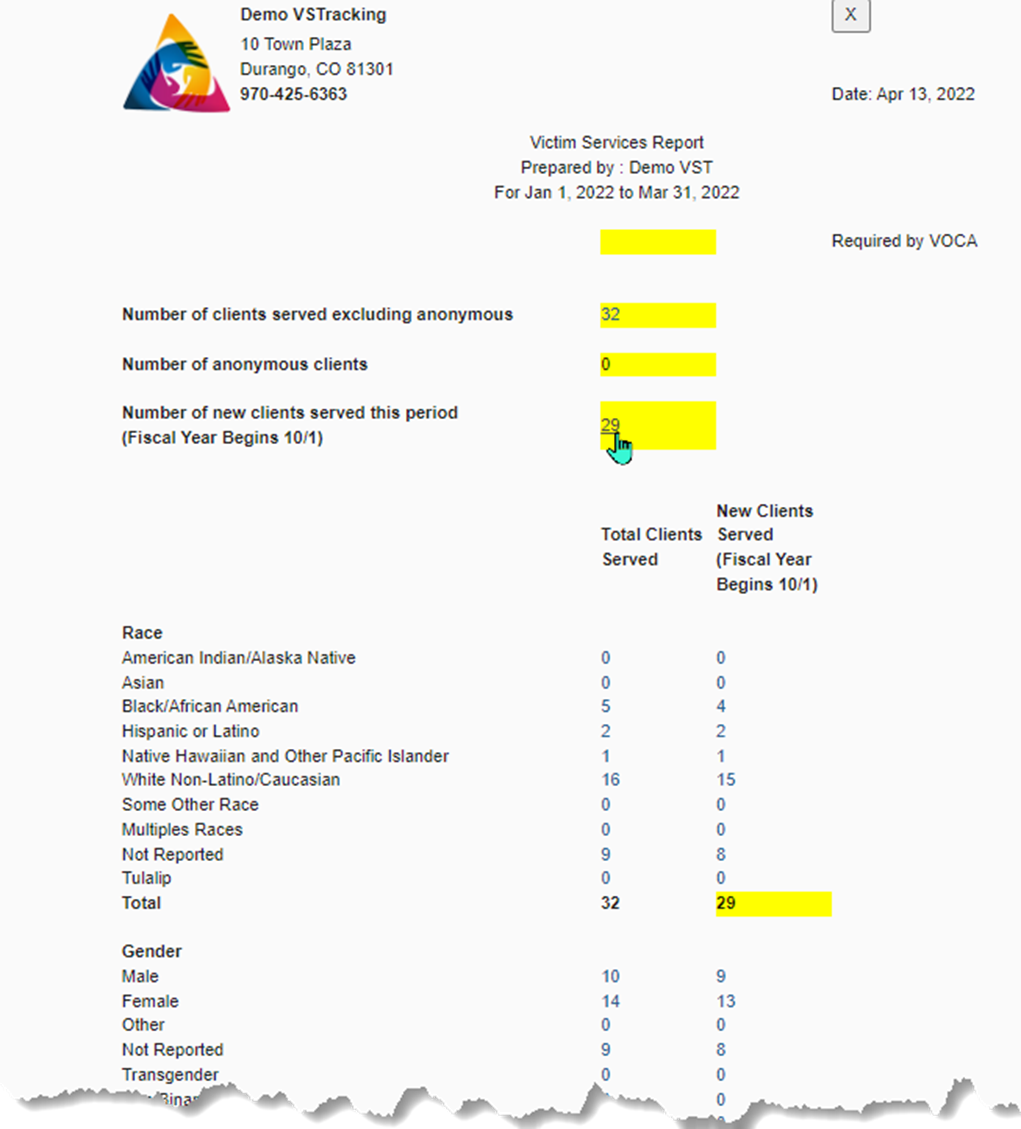
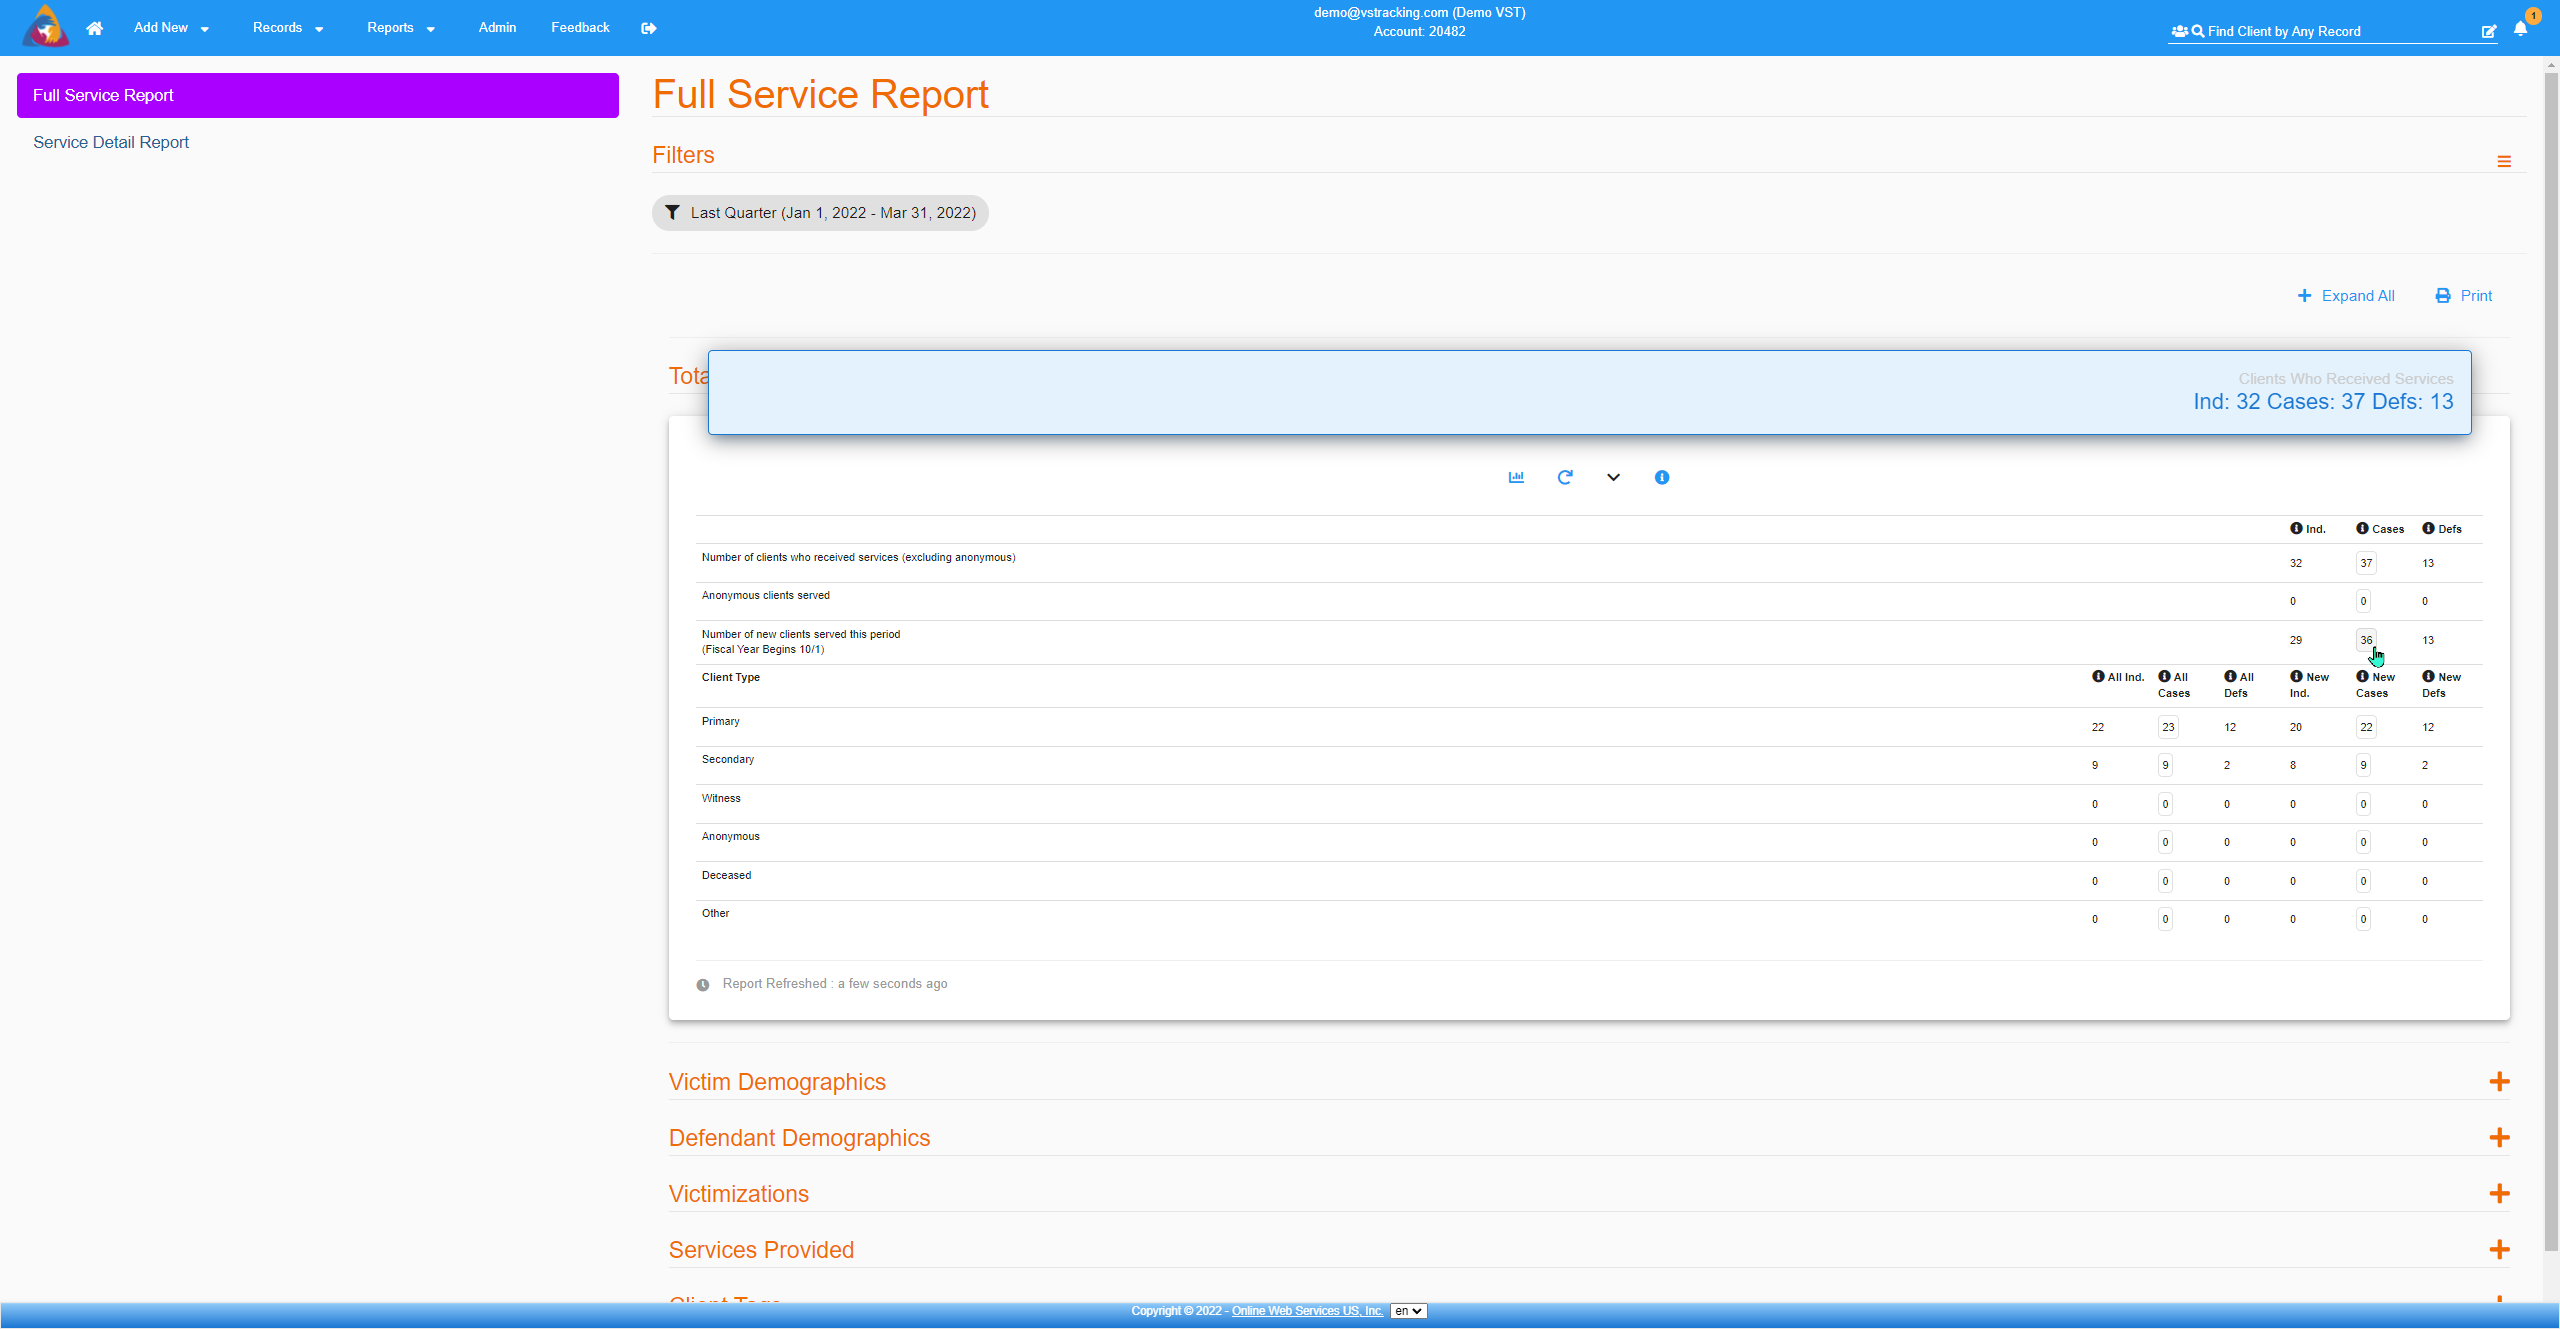
The images above show the Classic and Dynamic Full Service reports and the cursor has changed indicating the number can be clicked on to view the Client List report that includes the victim/clients included in that number.
Please note that the number indicated in the Classic Full Service report image above, 29, is the UNDUPLICATED number of victim/clients served. That number will match the number of Individuals shown in the Dynamic Full Service report image below it.
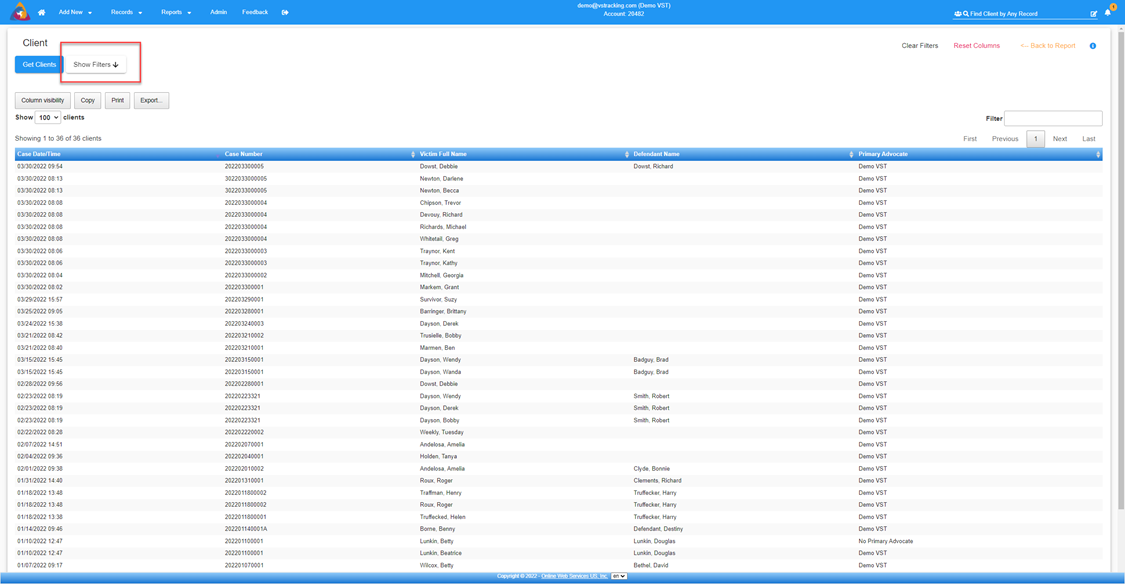
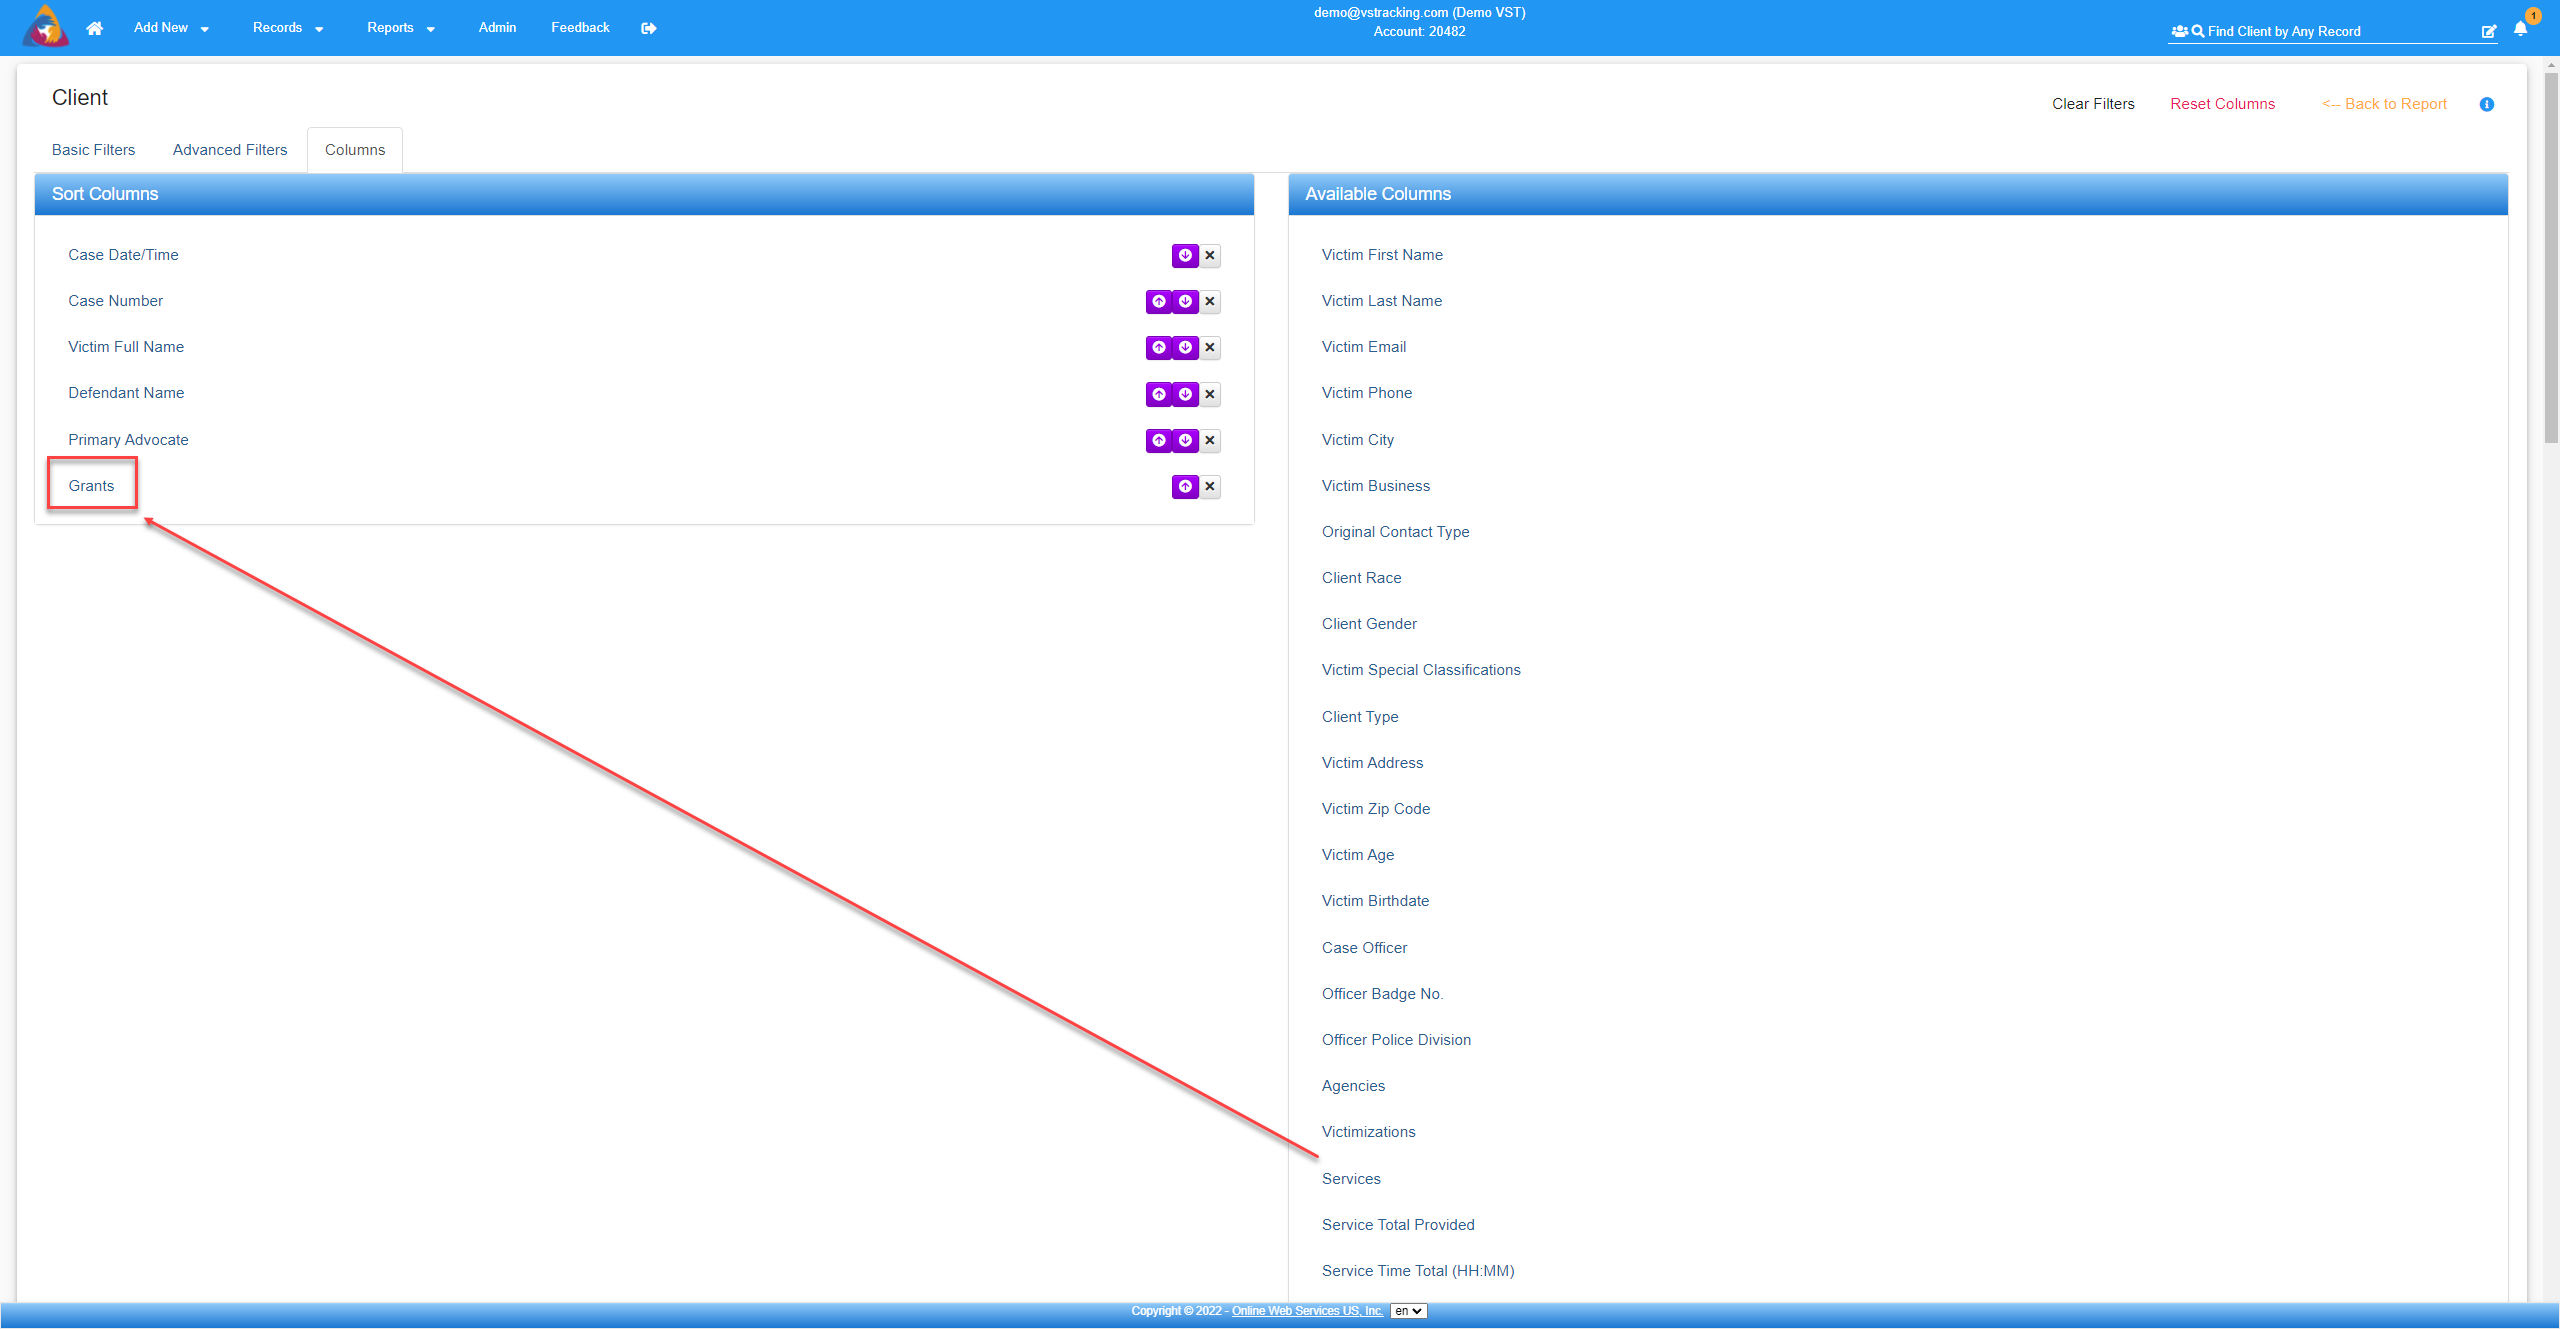
Once you have created the Client List report of the victim/clients being reported, you can click on "Show Filters" and add or remove filters to the report. For the purposes of this example though, we are going to add the column 'Grants' to the report:
Image of the Client List report created from either the Classic or Dynamic Full Service reports


Image of the Client List report filters with Grants being added to the columns


Image of Client List report with grants column highlighting the missing grants
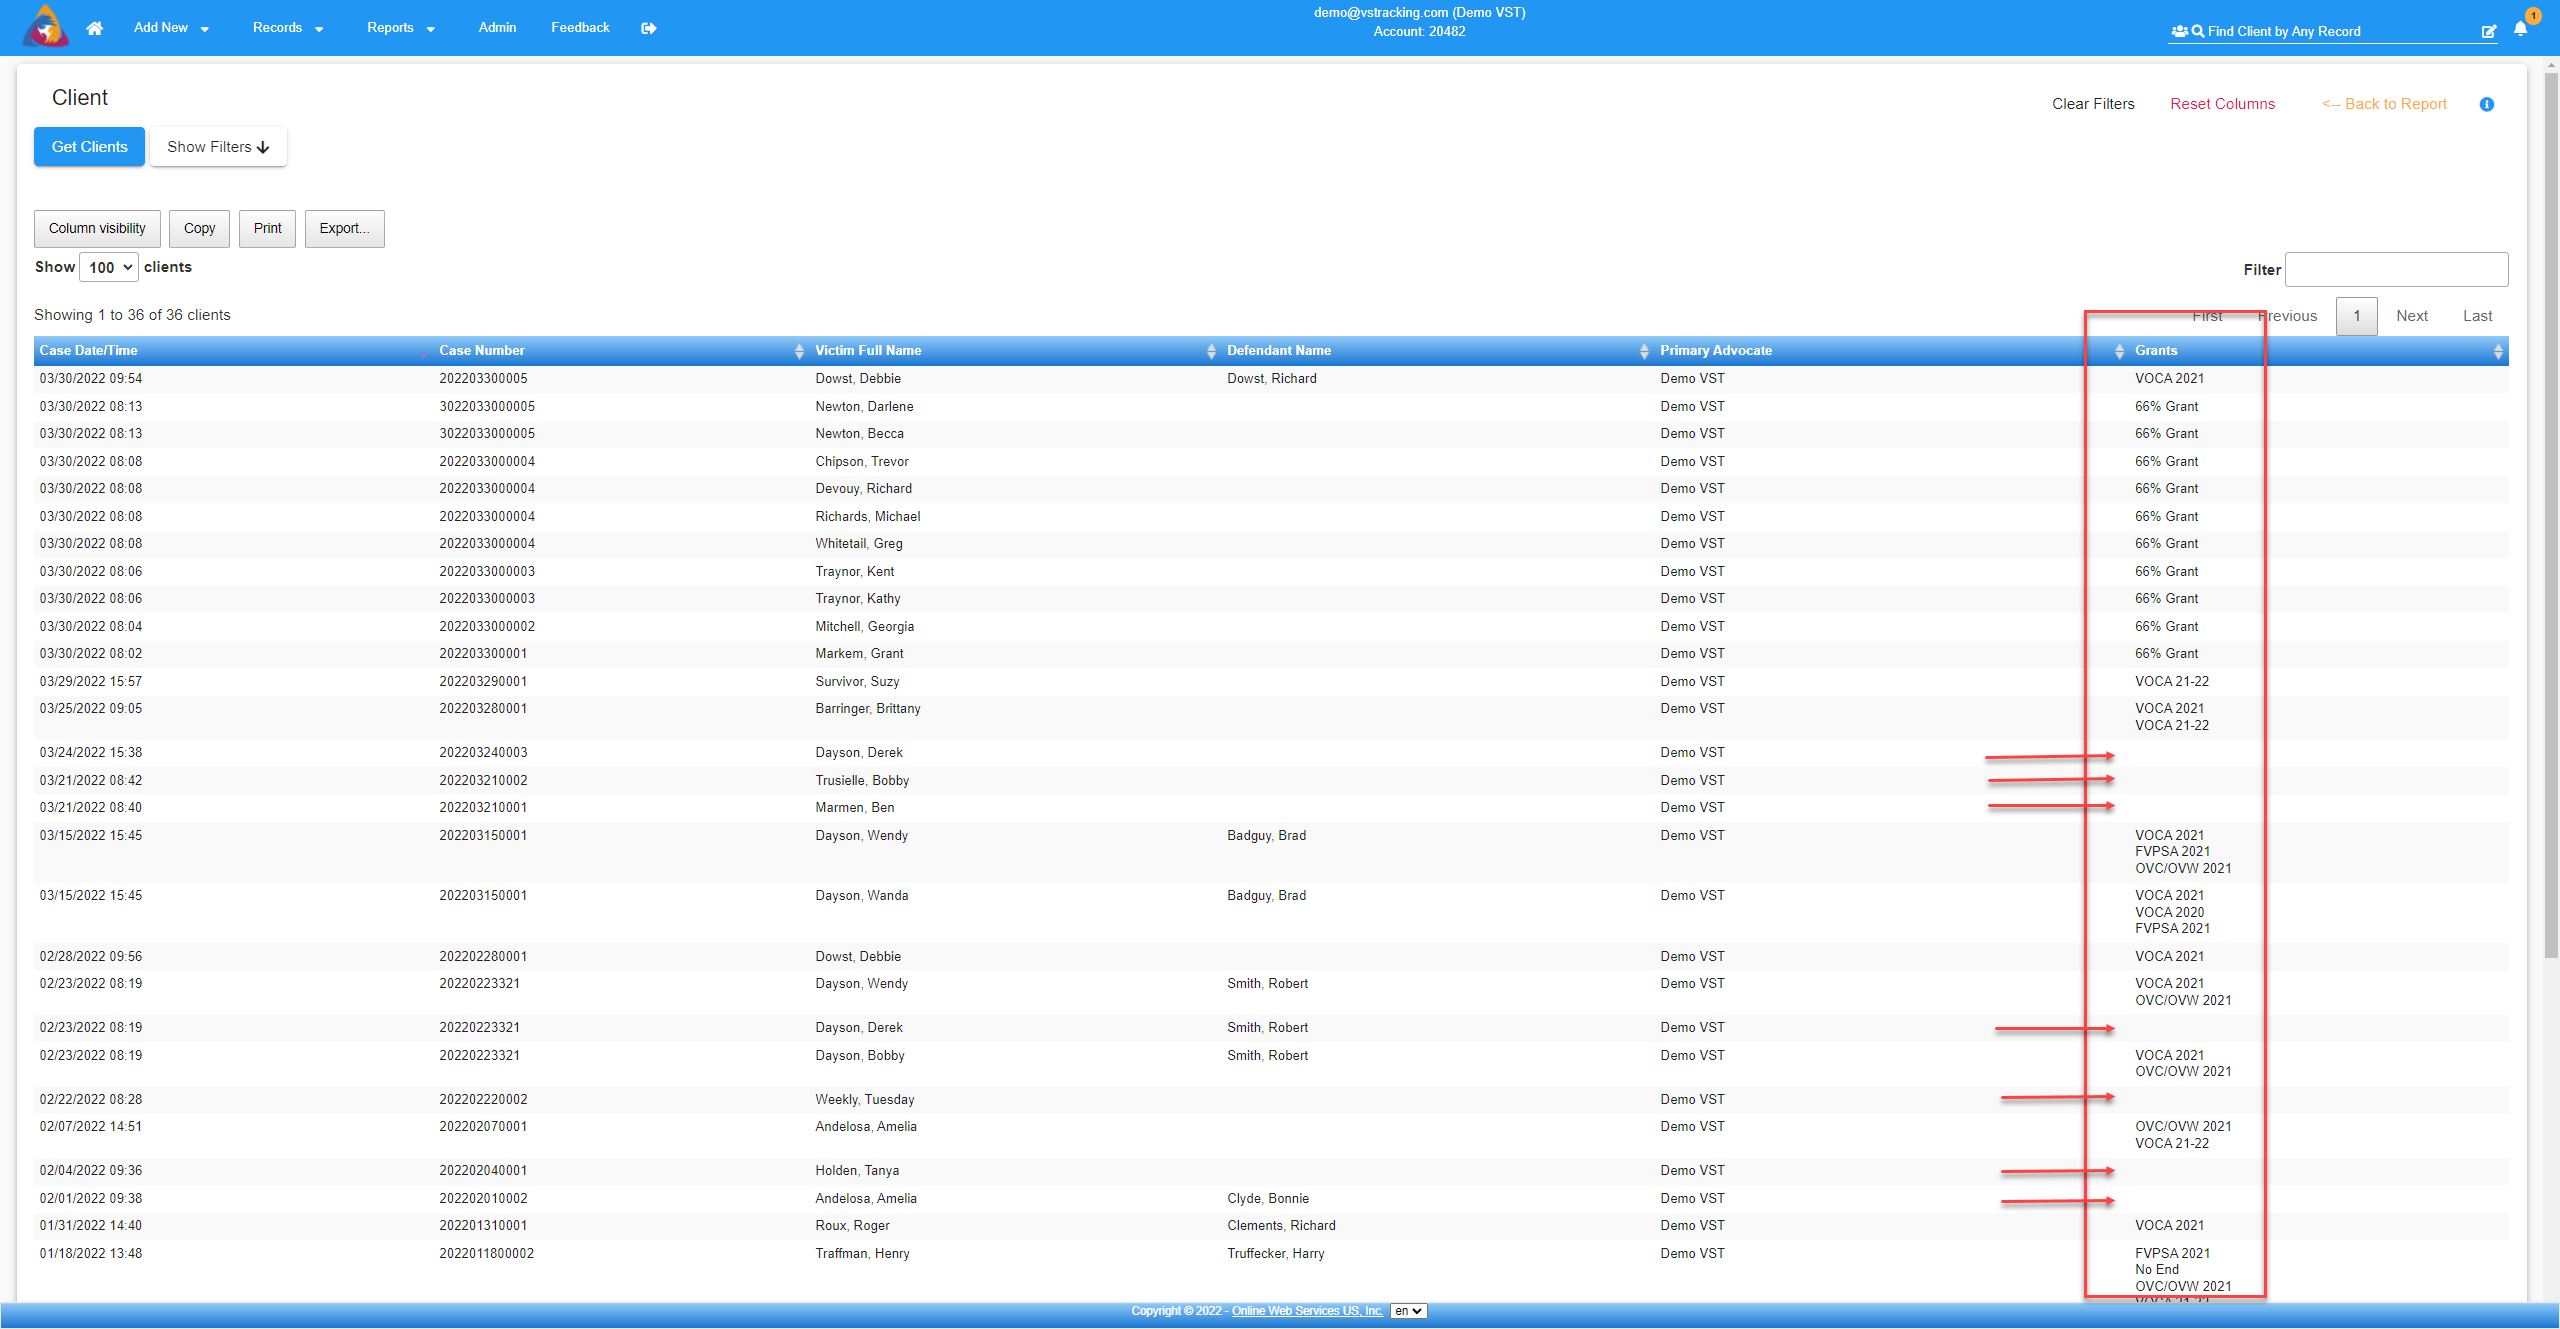
Each of the victim/clients can be clicked on to view their screens and edit their information, in this case adding the missing grants.