
This article will detail the process of generating a Service List Report through the Classic Reports Screen.
Navigating to Classic Reports
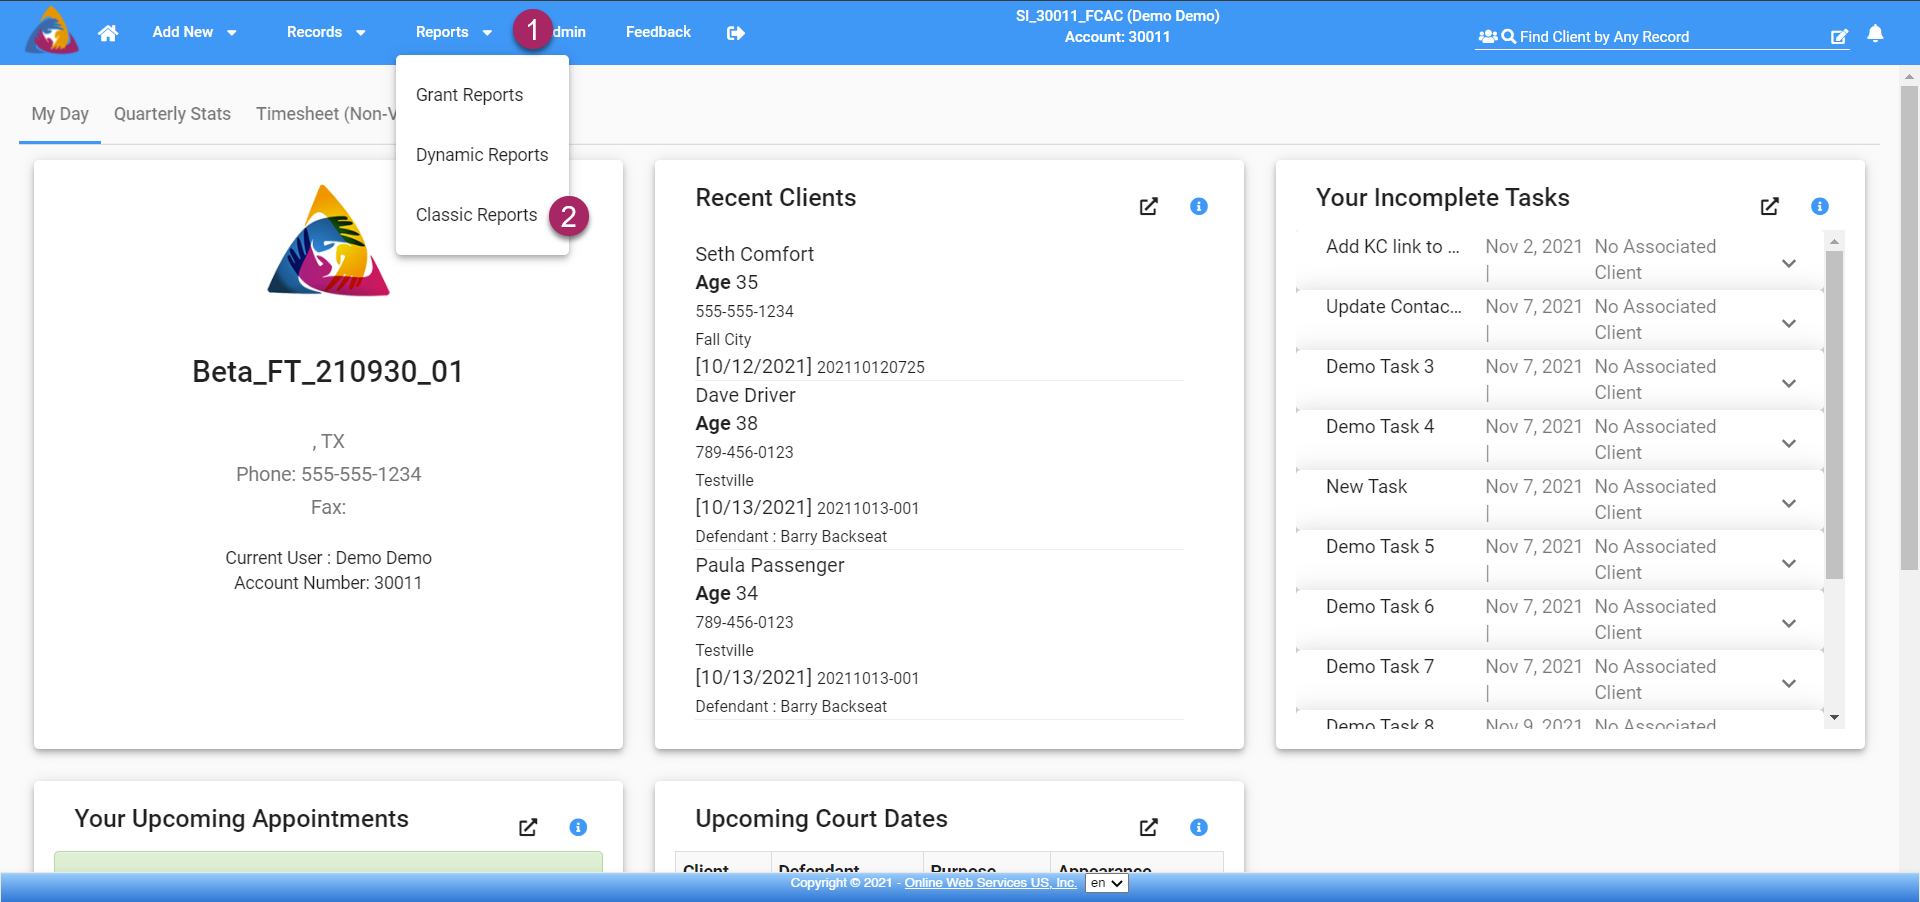
- Start by clicking the "Reports" dropdown on the top blue bar.
- This will open a list of pages, select "Classic Reports" by clicking on it.
Service List

- To generate a Service List Report, start by clicking the blue button labeled "Service List". This will open the Service List Report Screen.

On the Service List Report Screen, you are able to enter the filters you wish to filter your report with by using the three tabs across the top of the page: "Basic Filters", "Advanced Filters", and "Columns". There are some options available on every tab that will be detailed below. Each of the tabs will be detailed in the sections after.
- At the top of the page are 3 tabs that each offers unique filtering options: Basic Filters, Advanced Filters, and Columns. Each of these will be detailed in its own sections below.
- at the bottom of the screen are two blocks, the first is labeled "Filters". This block will show you the current filters you have applied to your report. Filters can be removed by clicking the grey "X" to the right of the filter you wish to remove.
- The block to the right is labeled "Columns (Max 7)". This block shows you the current columns that will be displayed at the top of the report once it's generated. You may have a total of 7 columns of information on your report.
- Once all desired filters have been applied, you can click the blue button labeled "Get Services" and your report will be generated.
- If you have already generated a report and wish to hide the filters tab, you can click the grey button labeled "Hide Filters".
- At the top of the page, you will see "Clear Filters" in black text. This can be clicked to remove all of the filters that you have applied to your report if you would like to start with a clean slate.
- Next, you will see "Reset Columns" in red text. Click this to reset the columns of your report to the default 7 columns set by the software.
- Finally, in yellow text, you will see "<- Back to Report". Clicking this will take you back to the Classic Reports Screen.
Basic Filters
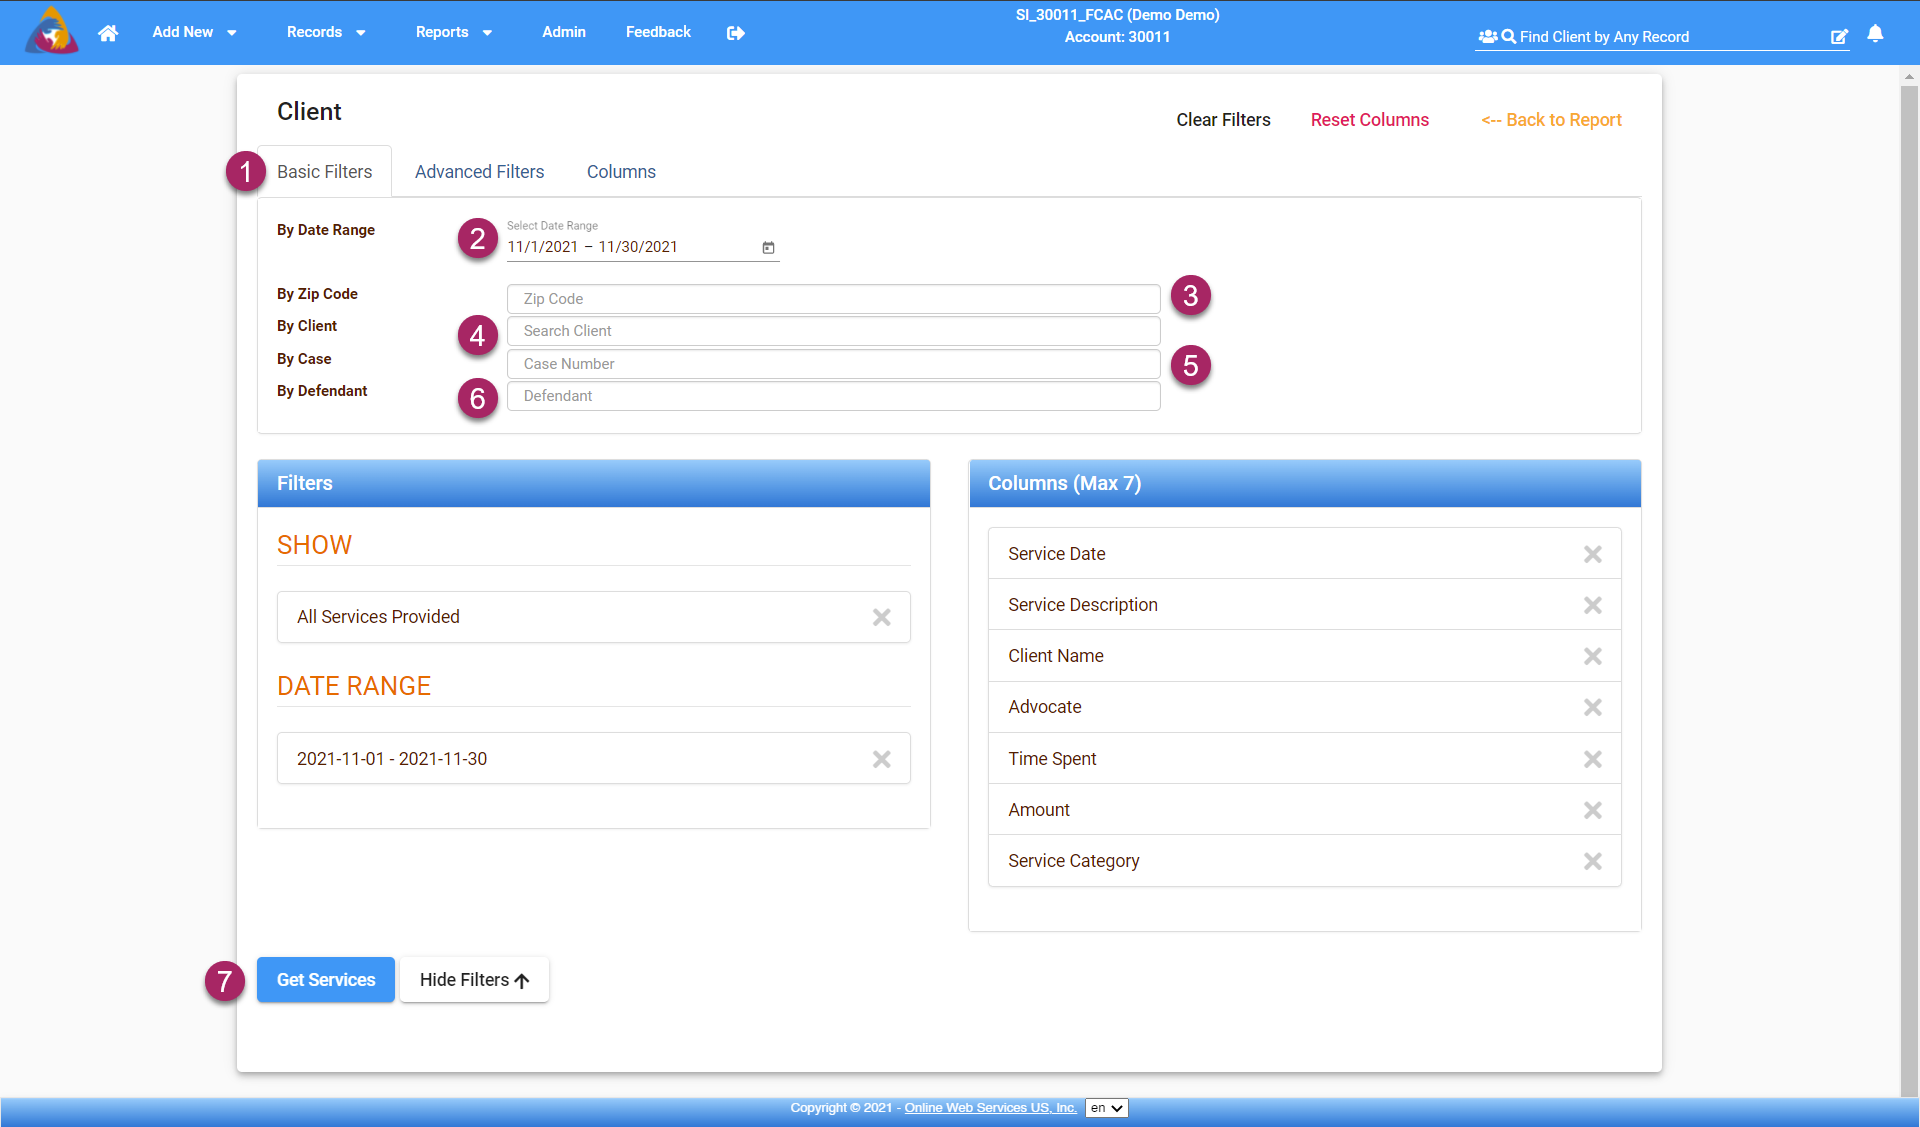
- The Basic Filters tab can be accessed by clicking the tab at the top of the screen labeled "Basic Filters".
- The first filter you will see on the Basic Filters tab is labeled "By Date Range". In the field to the right, click the calendar icon and a calendar will open, allowing you to select the date range in which you want the report to look for data.
- Next, you can filter by location using the field labeled "By Zip Code". Enter a zip code in the field to the right.
- You are able to filter by a specific client in the field to the right of "By Client". Type the name of the client you wish to see services for in the field.
- If you wish to see the services provided during a specific case, you can do so by entering a case number into the field labeled "By Case".
- Lastly, you can filter your report by a specific defendant. This will show services provided to clients that have been involved in cases with that defendant. Enter a defendant's name into the field labeled "By Defendant". Note: An administrator on your account must enable the Defendant Manager Module before you will be able to add and manage clients and use them to filter your reports. For more info, see the article: What is the Defendant Manager Module?
- If you only wish to filter your report with Basic Filters and are ready to generate your report, click the blue button labeled "Get Services" and your Service List Report will be generated.
Advanced Filters

- To add advanced filters to your Service List Report, click the tab at the top of the page labeled "Advanced Filters". This will display advanced filtering options on the screen.
- There are 5 dropdown tabs on the Advanced Filters tab. Each can be expanded to show a checklist of filters for each category. Simply click on a tab to expand it. The first tab is labeled "Limit by Advocate" and allows you to filter the data in your report by a specific client.
- Once the "Limit by Advocate" tab has been expanded, you will see a checklist that lists the names of advocates in your agency. Filter your report to a specific advocate by checking the checkbox to the left of their name. If none are selected, the report will show data for all advocates.
- The next dropdown tab is labeled "Limit By Agency". This tab allows you to select specific agencies you wish to see services for. Once expanded a checklist will list all of your agencies. Note: You must be using the Enterprise version of the VST software to add and manage multiple agencies. For more info see the article: How do I Add/Edit Agencies?
- Click the dropdown tab "Limit by demographic to open a list of tabs for each demographic category (race, gender, etc.). Each demographic category tab can be expanded to show a checklist of all the options within that category (i.e. the race tab will expand to show types of races).
- Next, you can limit your report by the tags added to services. Click the "Limit by Tags" dropdown tab and a list of tabs labeled with Tag categories will open. Click on a category tab to expand it and view a list of tags in that category. Tags will be listed as a checklist allowing you to select one or multiple tags from multiple categories. Note: An administrator on your account must enable the Tag Manager Module before you are able to add, manage, and filter by tags. For more info, see the article: What is the Tag Manager Module?
- The final dropdown tab "Search by Custom Field", allows you to filter your report by Custom Fields that have been added to your system. Each custom field will be listed once the tab is expanded and will have a text box next to it. Enter a search term next to the custom field you want to filter by.

- If you are ready to generate your report, click the blue button at the bottom of the page labeled "Get Services". This will navigate you to a new screen showing the results of your report. If you wish to edit the columns of the report, continue reading below.
Columns
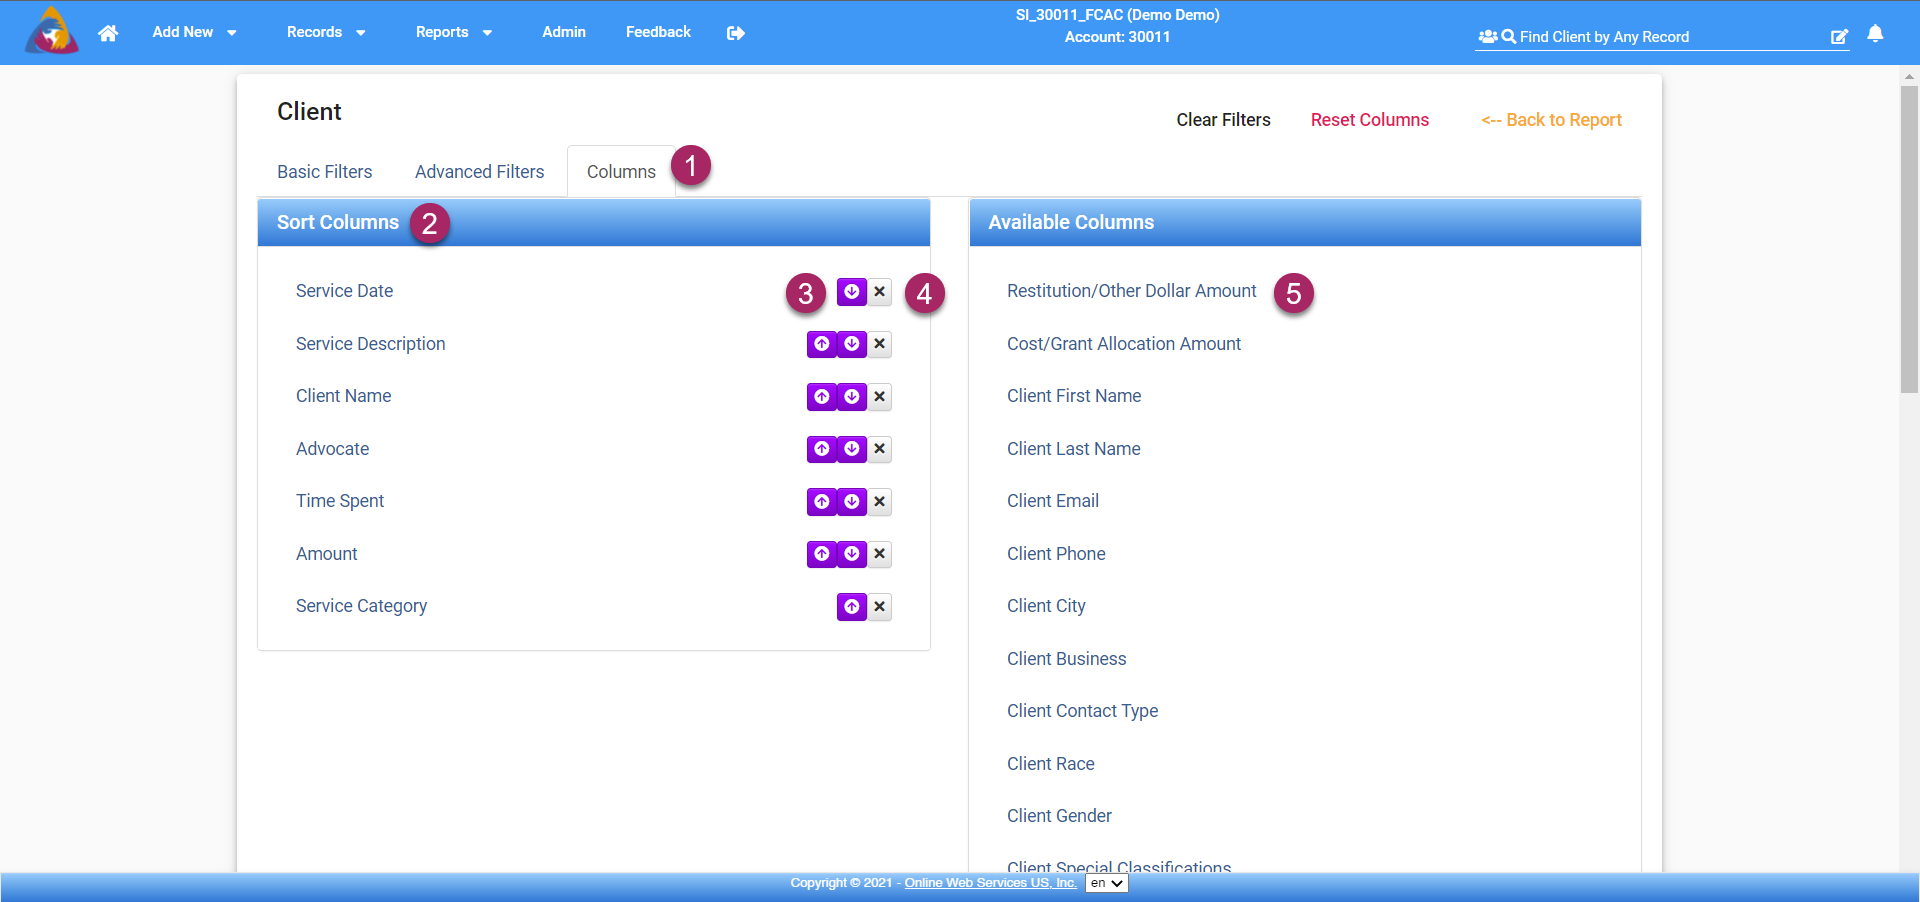
- To manage the columns of data that will be shown on your report, click the tab labeled "Columns". This will display options for columns on the screen.
- There are two blocks on this tab, the first is "Sort Columns". This will list the current columns that will be shown in the report. Columns will be shown on the generated report from left to right starting with the column that is at the top of the list.
- To move a column up or down the list, use the purple buttons with arrow icons. a button with an up arrow will move that item up the list. Vice versa, a button with a down arrow will move that item down the list.
- To remove a column, click the grey "X" button.
- On the right side of the screen is a block labeled "Available Columns". This block lists all of the columns that can be added to the report. Columns can be added by clicking on the name of the column you wish to add to your report. The maximum number of columns allowed is 7. If you have reached the max, you will need to remove a column before another can be added.
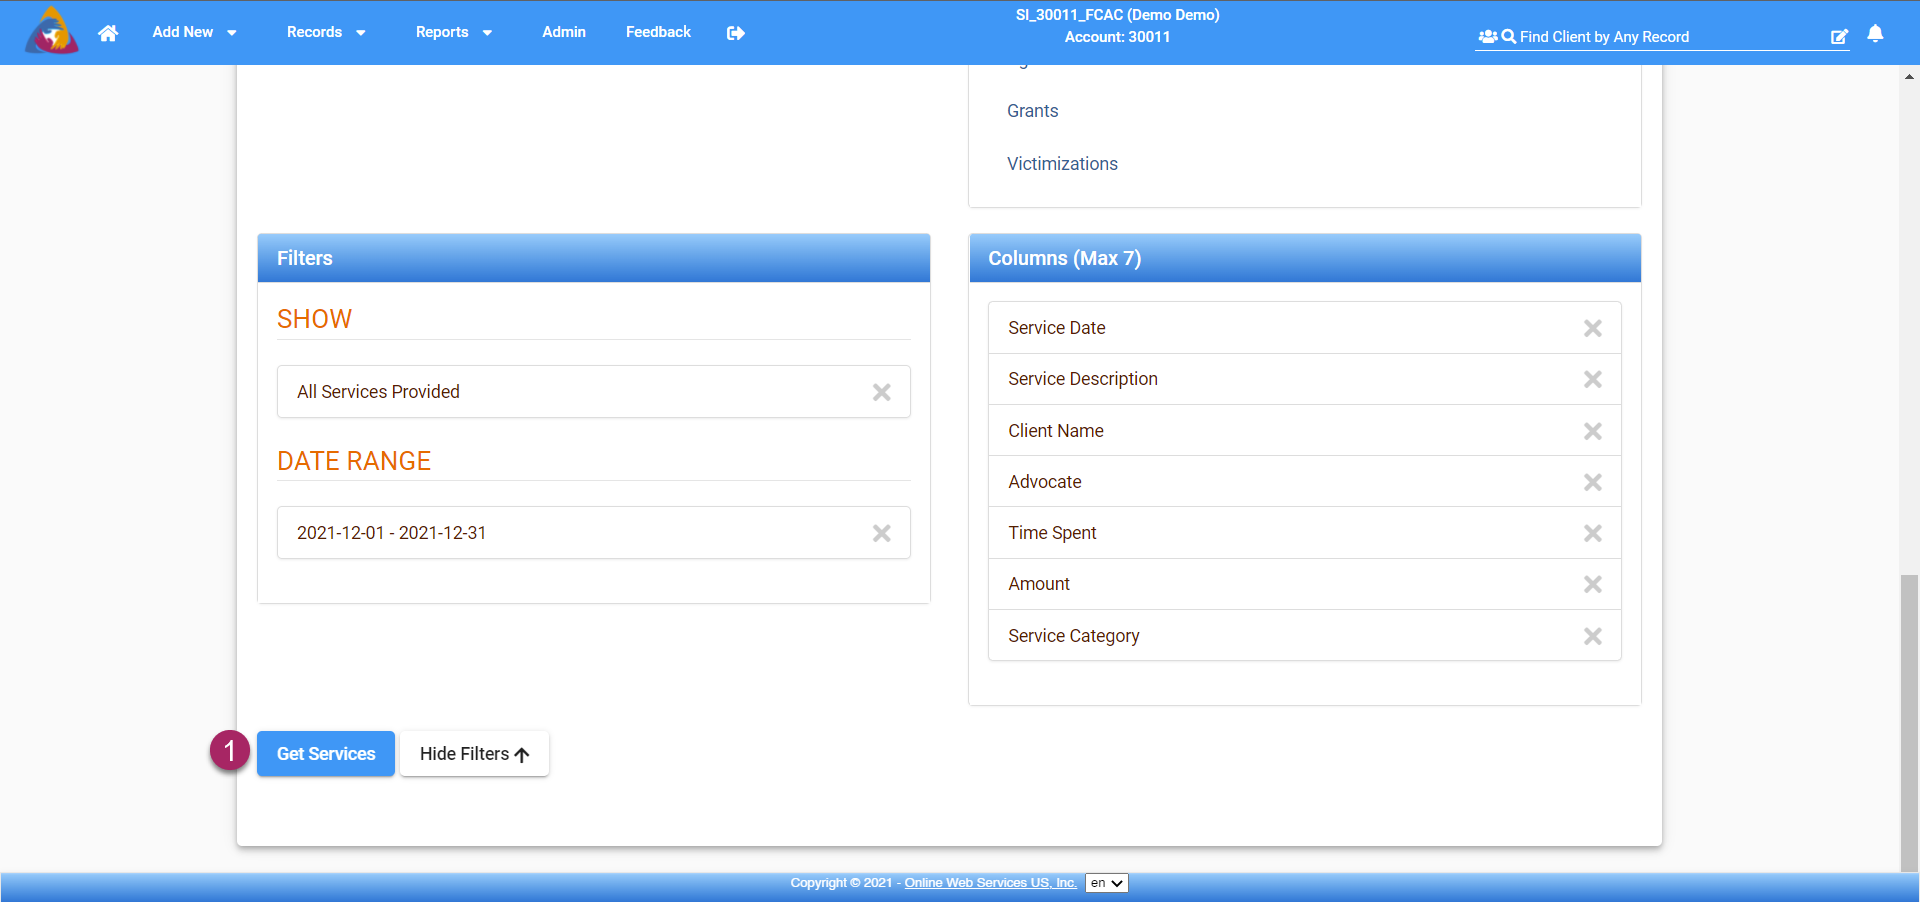
- Once you have added all desired columns and filters, click the blue button labeled "Get Services" at the bottom of the screen.