What is a Service Detail Report?
A Service Detail Report generates a report based on the services you have provided to clients. It provides data specific to each service.
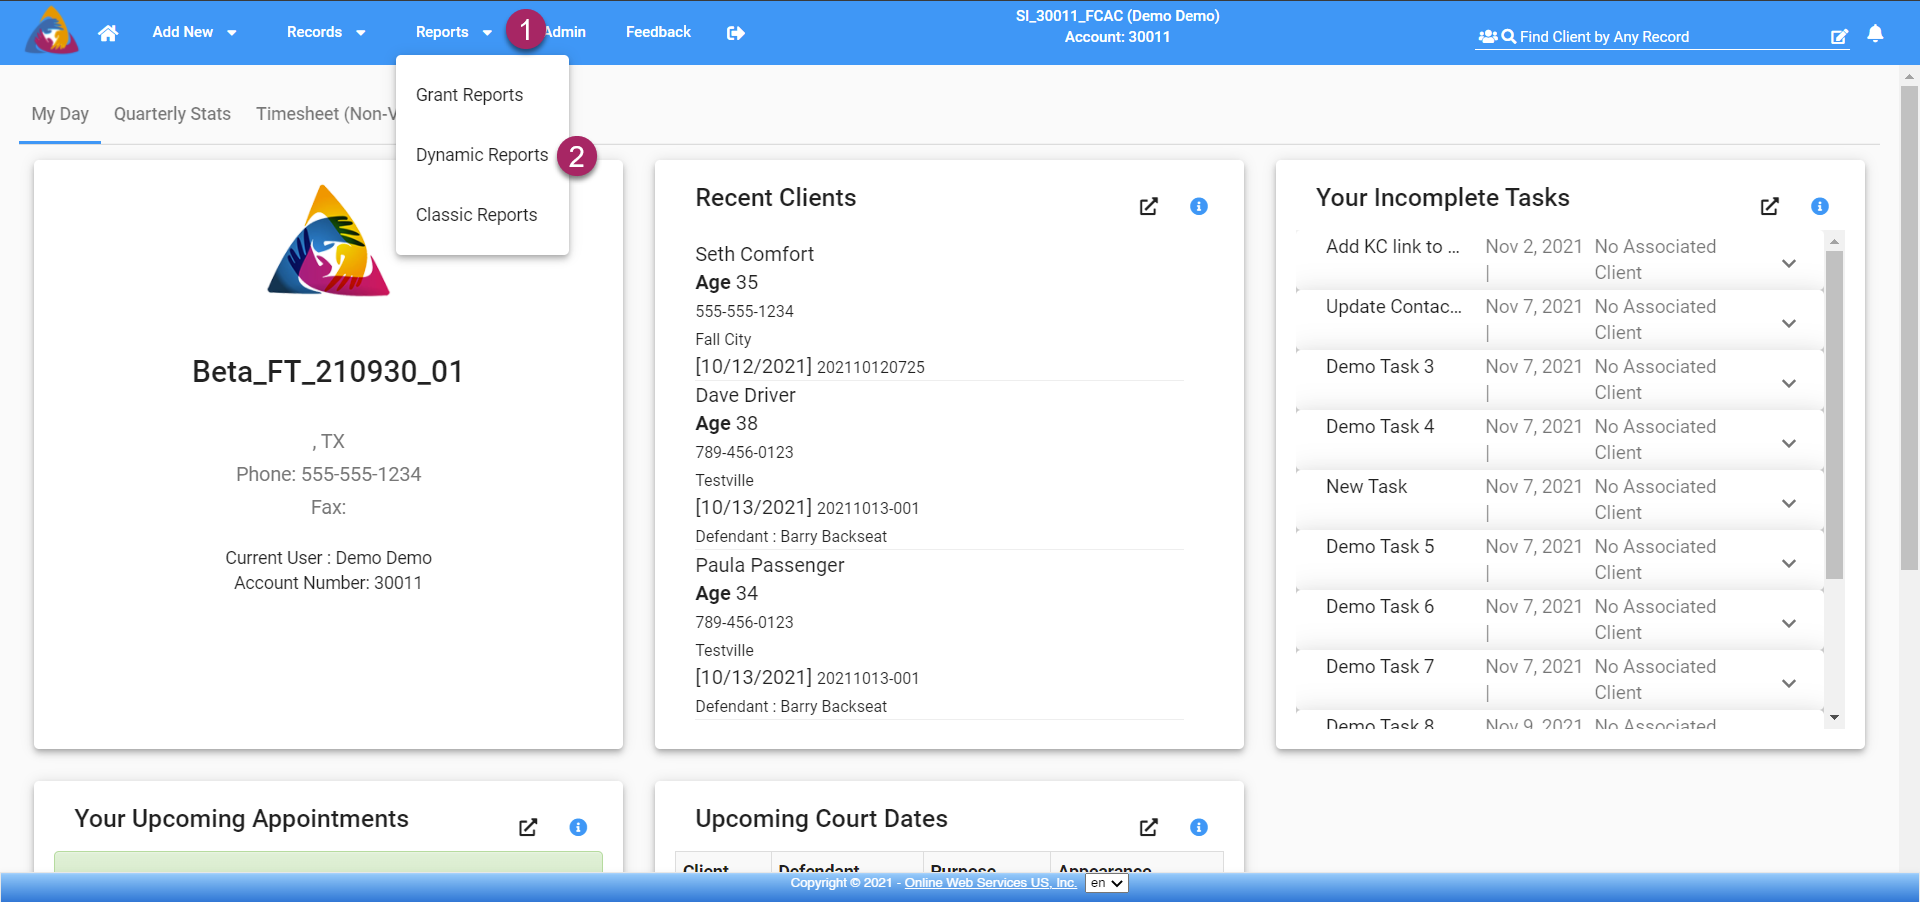
- Start by clicking the "Reports" dropdown on the top blue bar.
- Select "Dynamic Reports" from the dropdown list and you will be taken to the Dynamic Reports Screen.
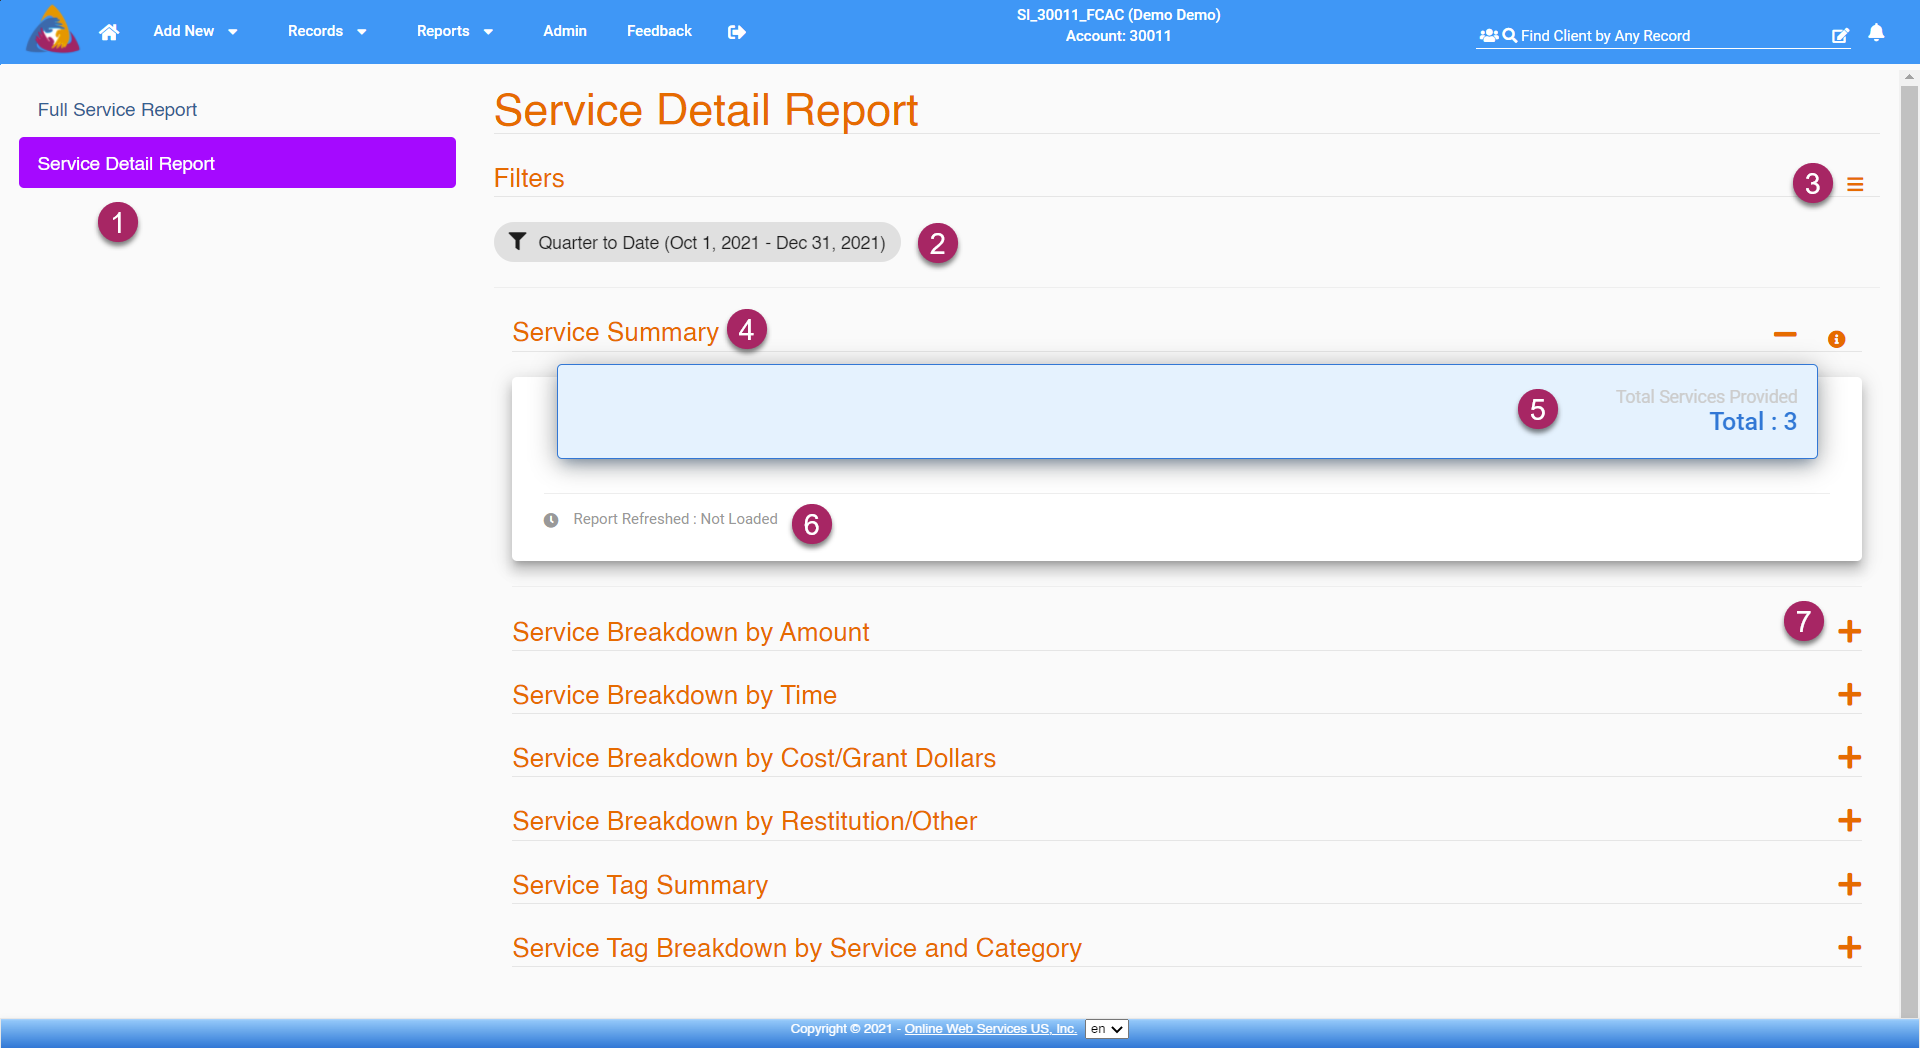
- Once you have arrived on the Dynamic Reports Screen, Select "Service Detail Report" on the left side of the screen. Clicking this will show the Service Detail Report on the right side of the screen.
- The report can be filtered by clicking on the grey button with a funnel icon that is labeled "Quarter to Date". This will allow you to filter the period of time in which the report will search for data.
- Filter settings can also be changed by clicking the yellow icon that looks like 3 bars at the top right of the screen.
- Next, you will see "Service Summary". Below this, you will see a summary of the data in the report.
- The blue block below "Service Summary" Will show you the total number of services provided. This number is total services regardless of their relation to a grant.
- Below the blue block is a grey clock icon and "Report Refreshed". This will show you how recently the report was refreshed. It is recommended to refresh the report often to ensure the data shown is as current as possible.
- You can view more detailed information in the report by expanding the tabs at the bottom of the screen. Each will show more specific data based on the category the tab is labeled with. Each tab contains multiple blocks of information when expanded. Expand tabs by clicking the yellow "+" icon on the right side of the tab. Once expanded each tab will show the totals for that category as well as data for specific services. This will be detailed below.
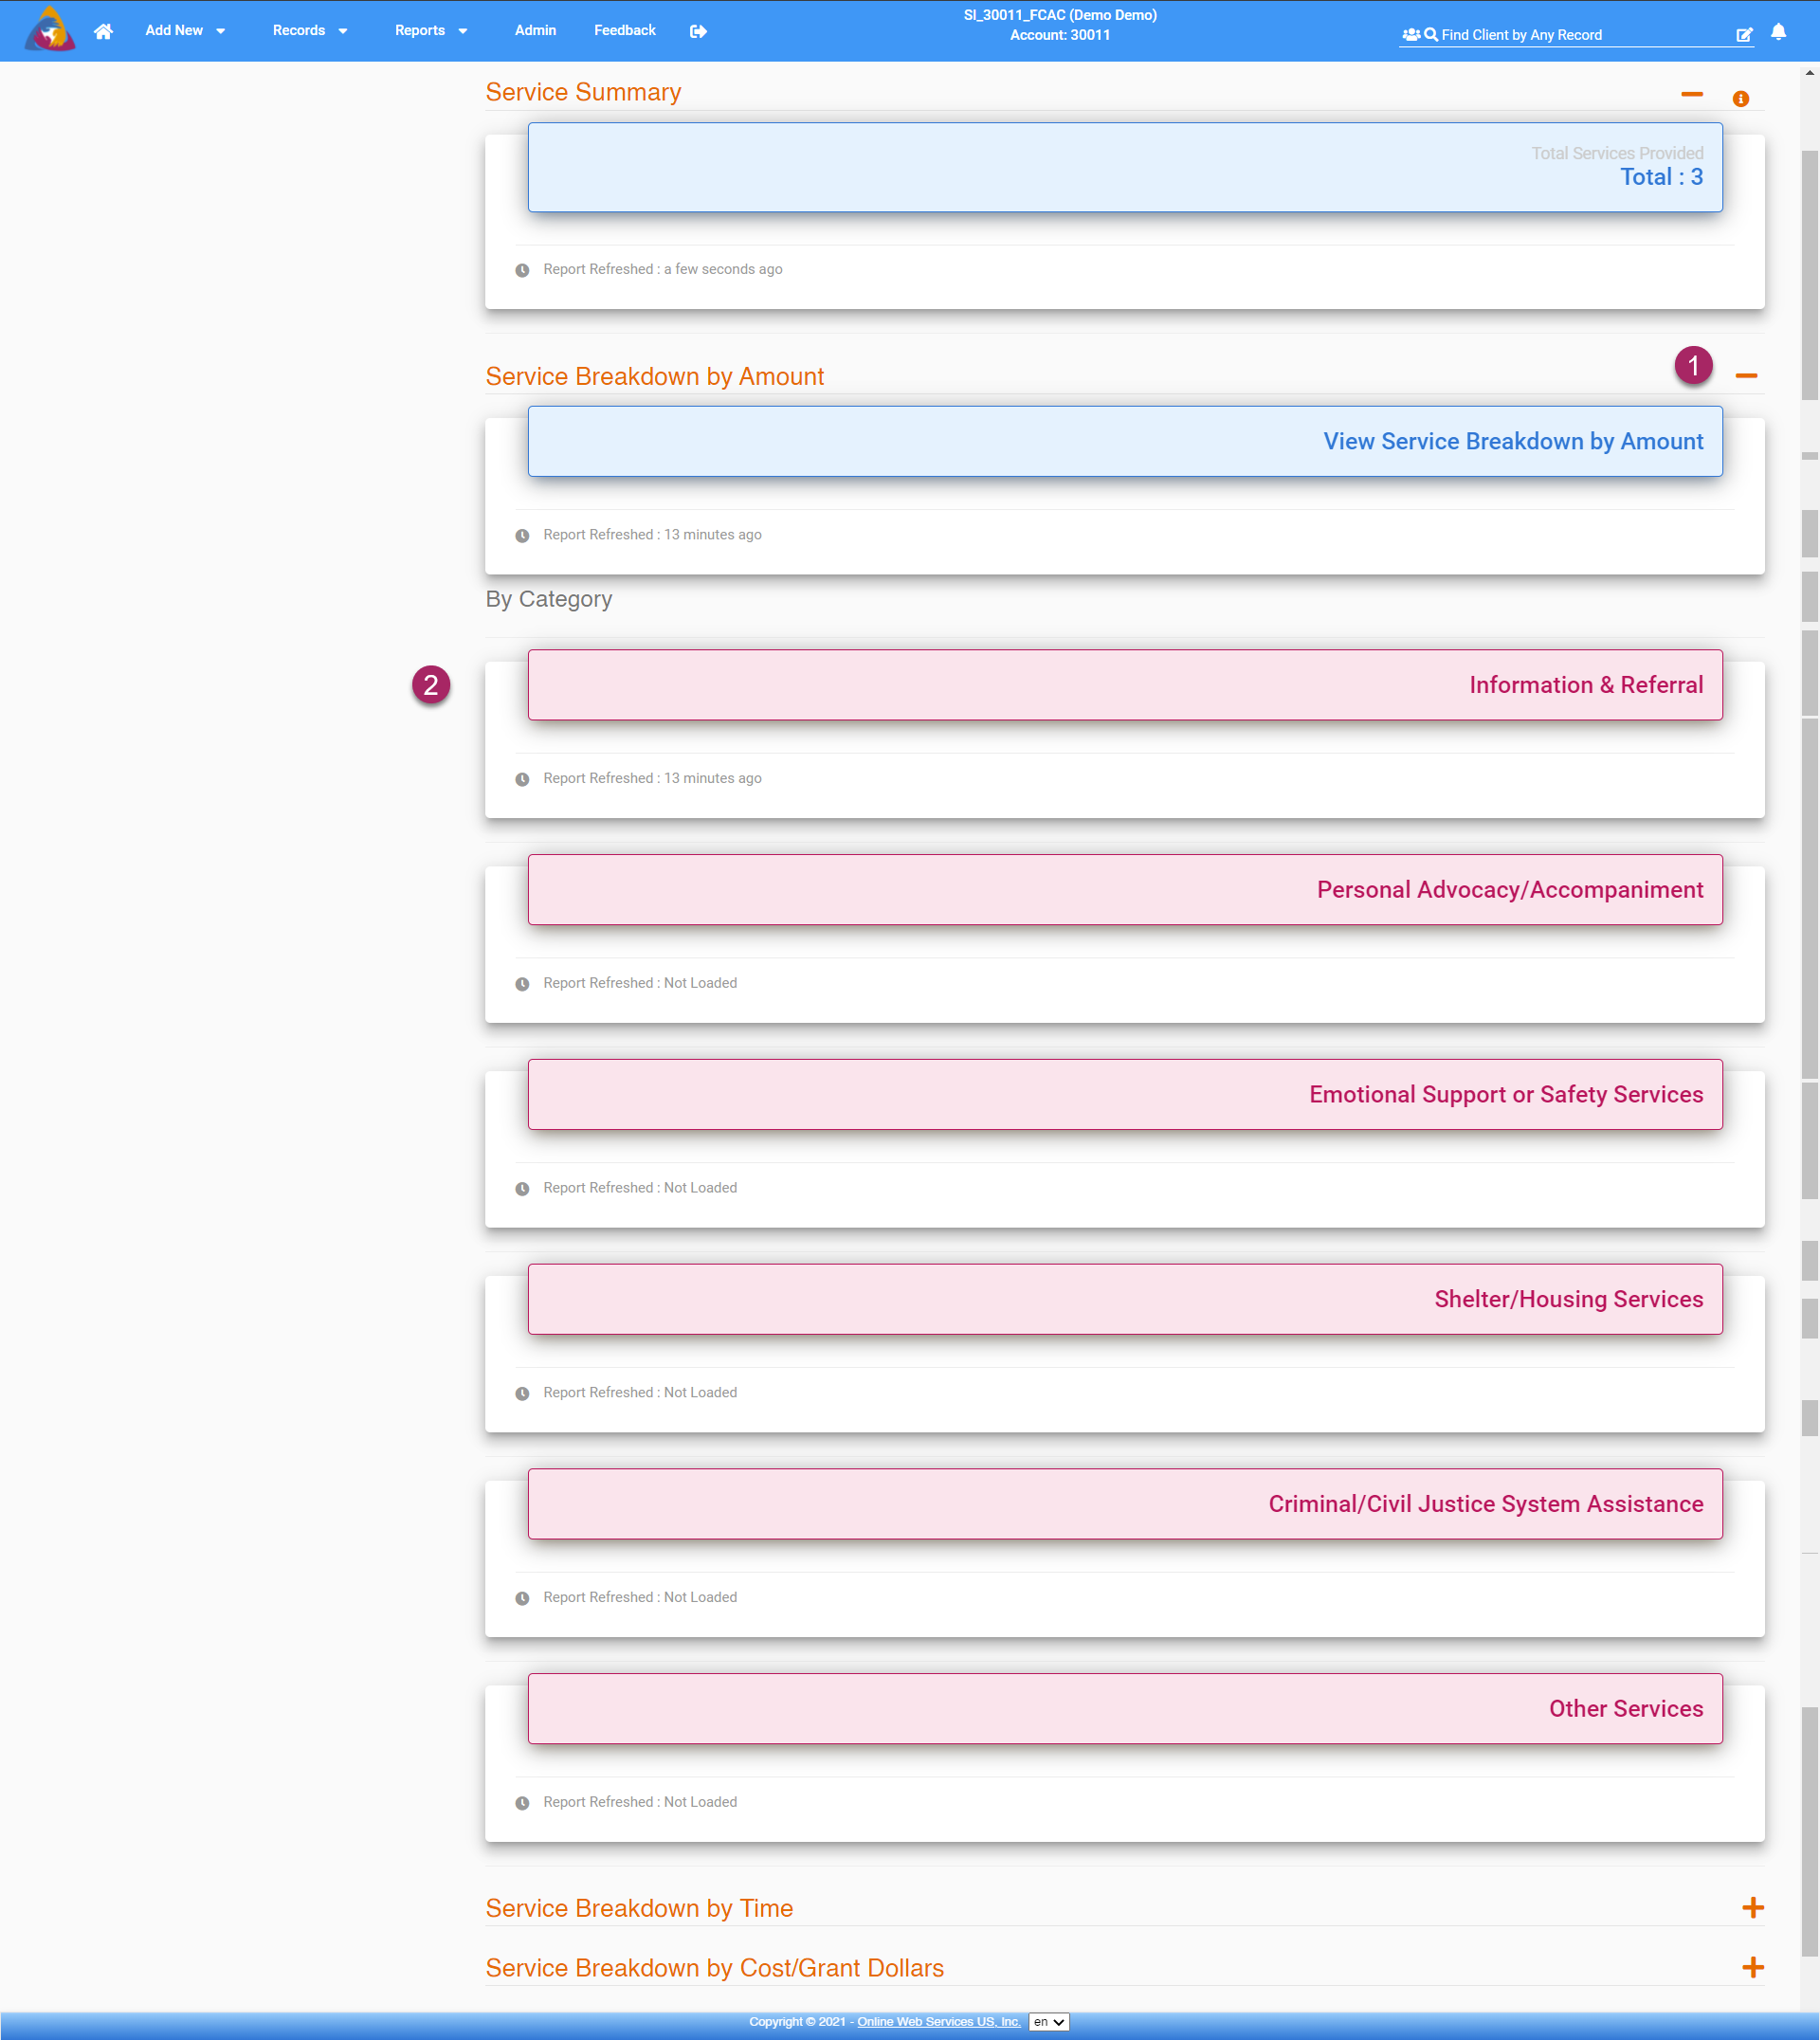
- After a tab has been expanded the "+" icon will turn into a "-" icon. Click this to close the tab.
- Each category will be further refined into the service categories: Information & Referral, Personal Advocacy/Accompaniment, Emotional Support or Safety Services, Shelter/Housing Services, Criminal/Civil Justice System Assistance, and Other Services.
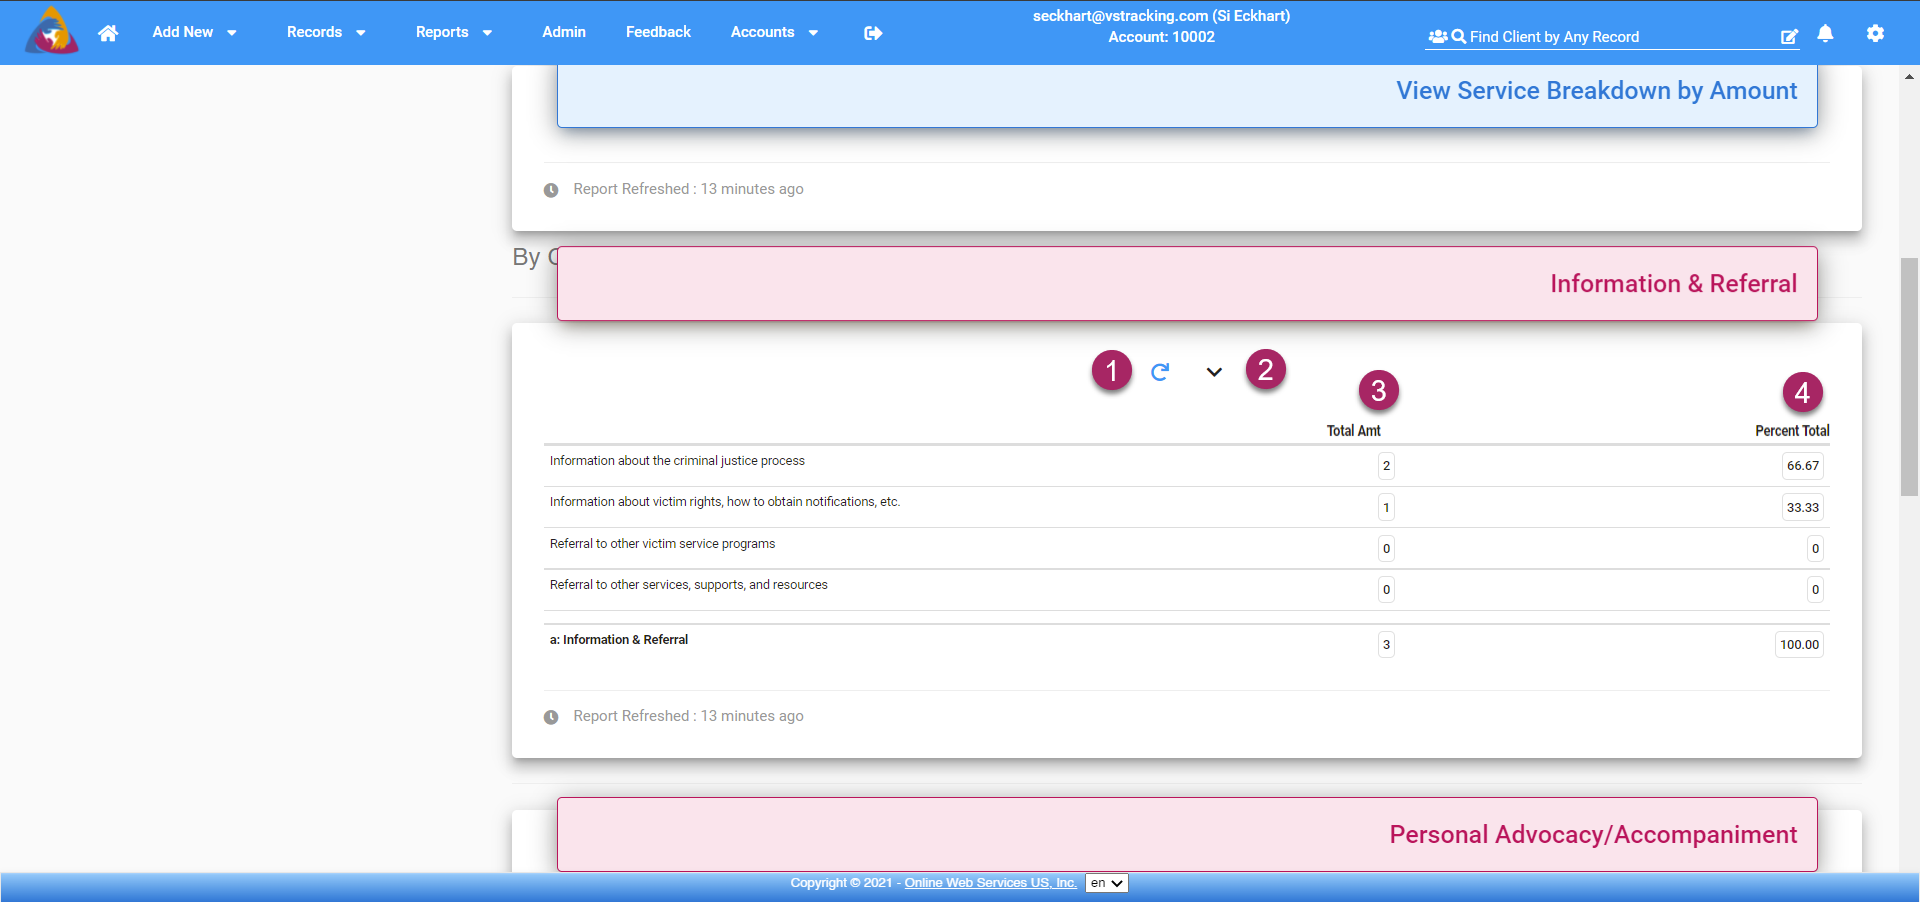
- Each further refined category can be hovered over to reveal more options. Move your mouse over the red block and you will see 2 buttons. The first is a blue arrow in a circle. Clicking this will refresh the data for the report.
- Click the down arrow icon will expand the block to show specific data.
- The table of data shows services within the refined category. First, it will show the total amount of that service offered in the column labeled "Total Amt".
- Next, it will show the percent that the service comprises out of the total of all services in that category.
Filtering Your Report - Basic Filters
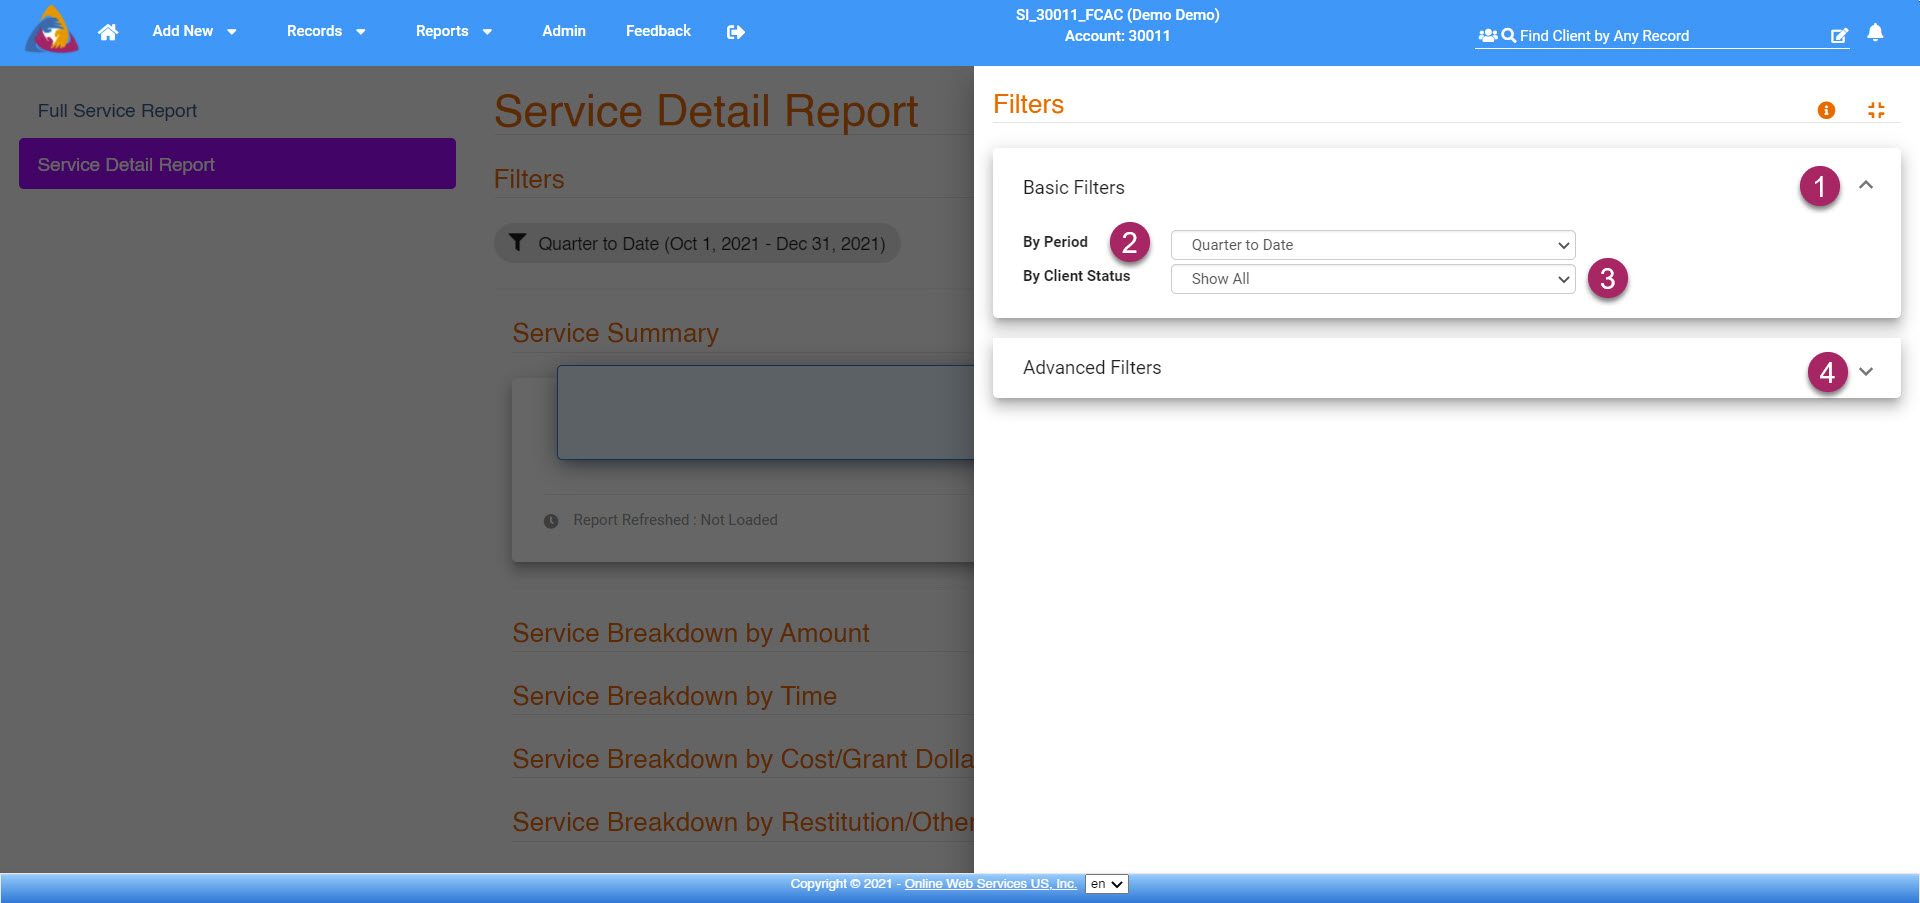
- After clicking either the grey "Quarter to Date" button or the icon that looks like 3 bars, a menu will open on the right side of the screen. Expand the dropdown labeled "Basic Filters" by clicking the arrow icon on the right side of its tab.
- Choose the period of time for which you want the report to show info by clicking the dropdown field to the right of "By Period".
- Choose to filter by client status in the dropdown field to the right of "By Client Status".
- To apply advanced filters click the arrow icon on the right side of the dropdown tab labeled "Advanced Filters". Applying advanced filters will be detailed below.
Filtering Your Report - Advanced Filters
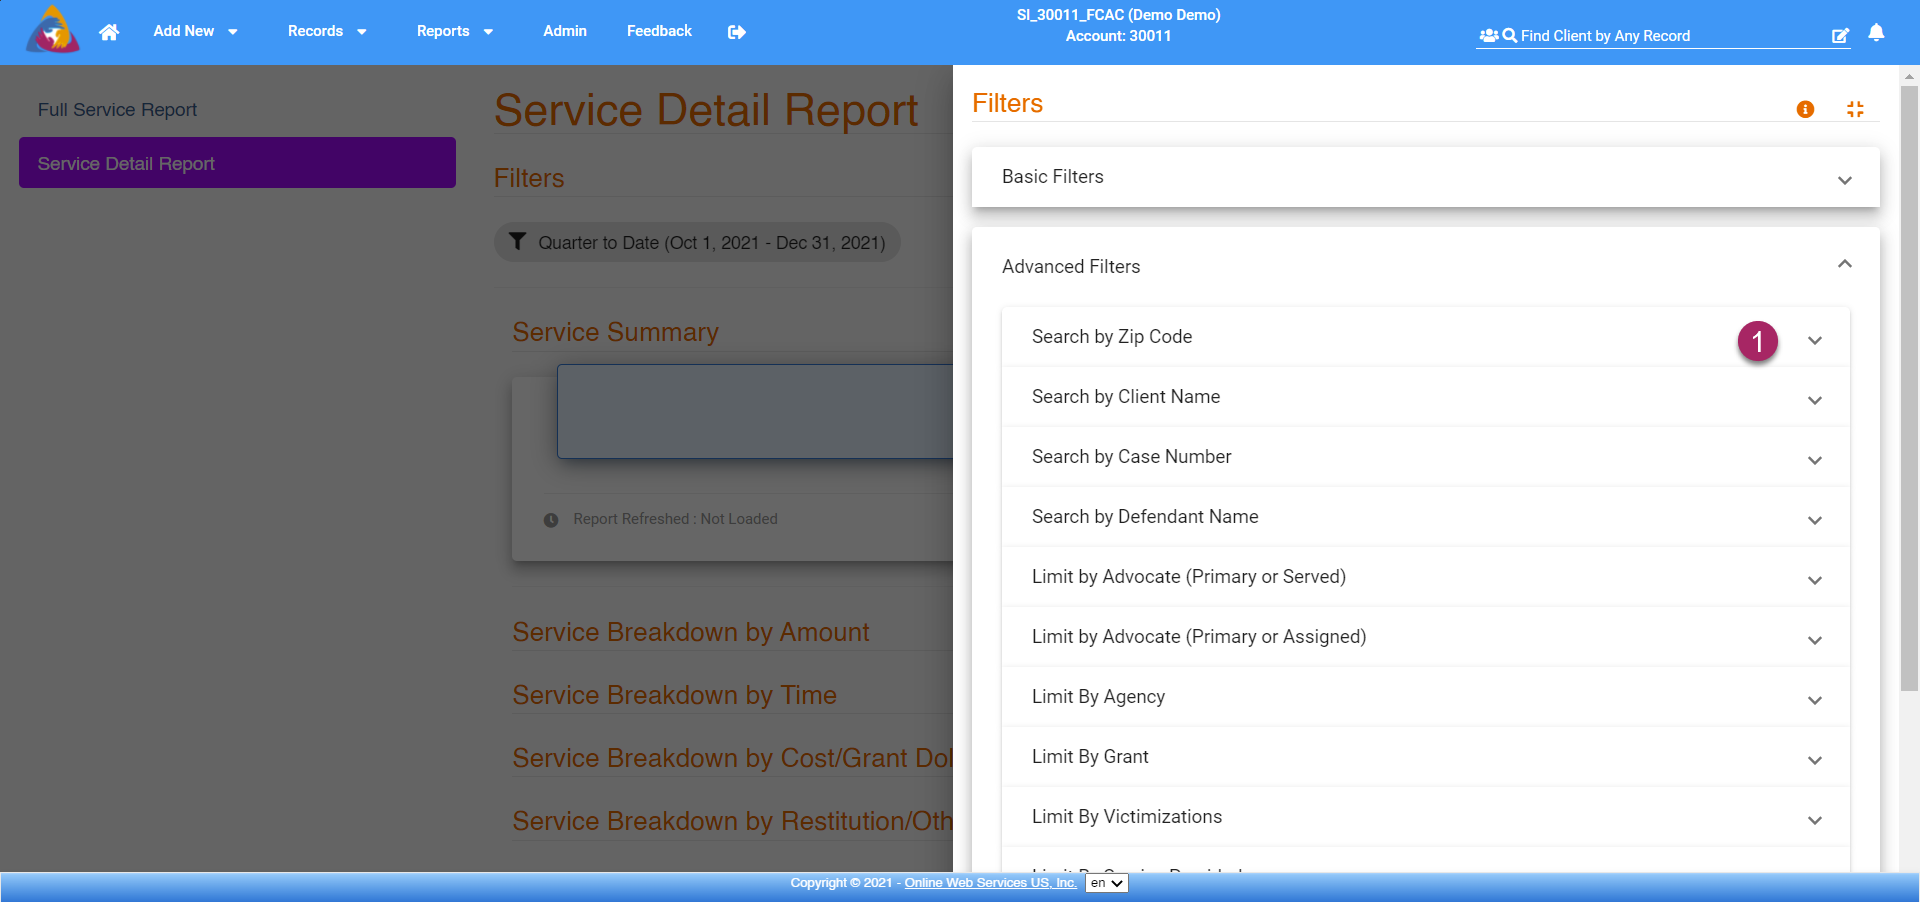
- A list of tabs for each advanced filter will be displayed when you expand the "Advanced Filters" tab. Click the arrow icon on the right side of any tab and you will be able to set options for that specific filter. Filters can be combined. To save and apply your filters, click on the left side of the screen and the side menu will be closed and your filters will be applied.
