How do I generate a Premium Report?
This article will detail the process of generating a Premium Report through the Classic Reports Screen.
Navigating to Classic Reports
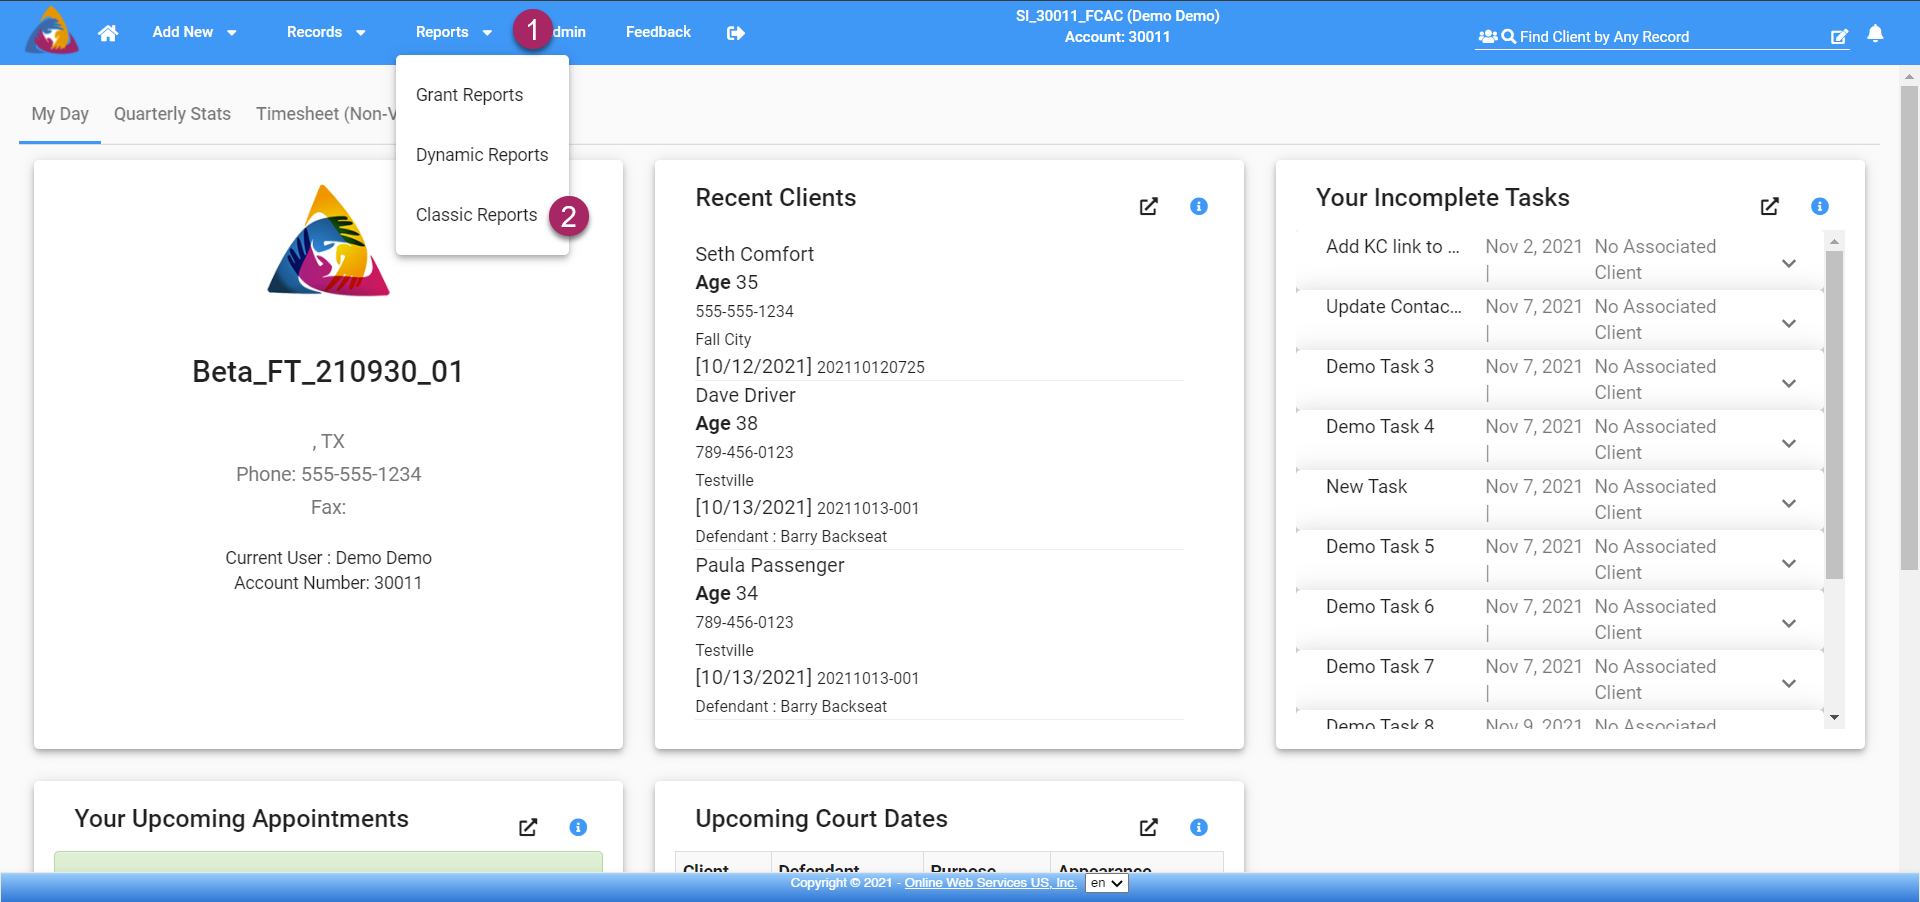
- Start by clicking the "Reports" dropdown on the top blue bar.
- This will open a list of pages, select "Classic Reports" by clicking on it.
Premium Report
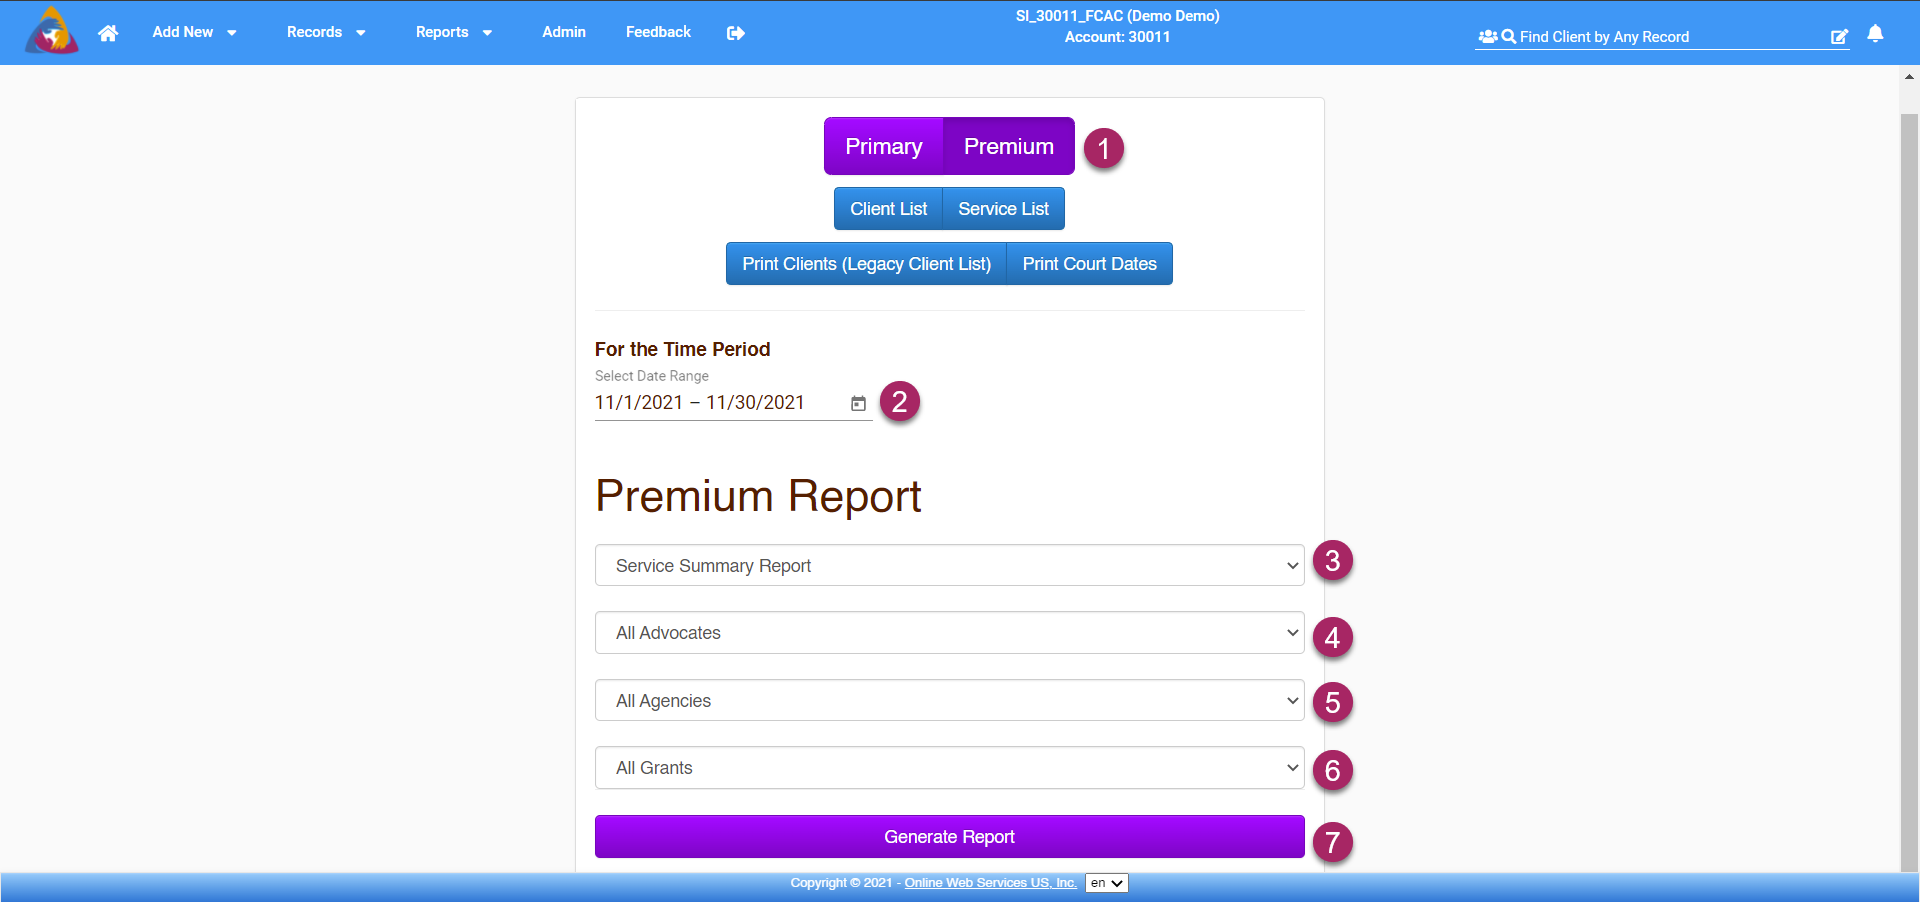
- On the Classic Reports Screen, click the purple button labeled "Premium", to start generating a Premium Report.
- You can select a date range for the report by clicking the calendar icon on the right side of the field labeled "Select Date Range". This will open a calendar allowing you to select the dates for your date range.
- The Premium Report can generate three types of reports. The type of report can be selected using the first dropdown field below "Premium Report". Clicking the dropdown will open a list of three options:
- Service Summary Report - A detailed report on all services offered.
- Timesheet Summary Report - generates a detailed breakdown of timesheet hours by Advocate, Task, and Grant.
- Daily Timesheet Report - generates a report that shows hours split by day.
- The next dropdown allows you to filter by a specific advocate. Note: When creating timesheet reports, an advocate must be selected.
- Next, you are able to filter the report by Agency. Clicking the dropdown will open a list of agencies to choose from. The generated report will only show data from that Agency. Note: You must be using the Enterprise version of the VST software in order to manage and report on multiple Agencies.
- Lastly, you can filter your report by Grant. Click the last dropdown and a list of your agency's grants (if more than one) will appear. Click the grant you wish to report on and the generated report will only show data linked to that grant.
- Once you have selected your desired filters, click the purple button labeled "Generate Report and you will be navigated to a page showing your report.
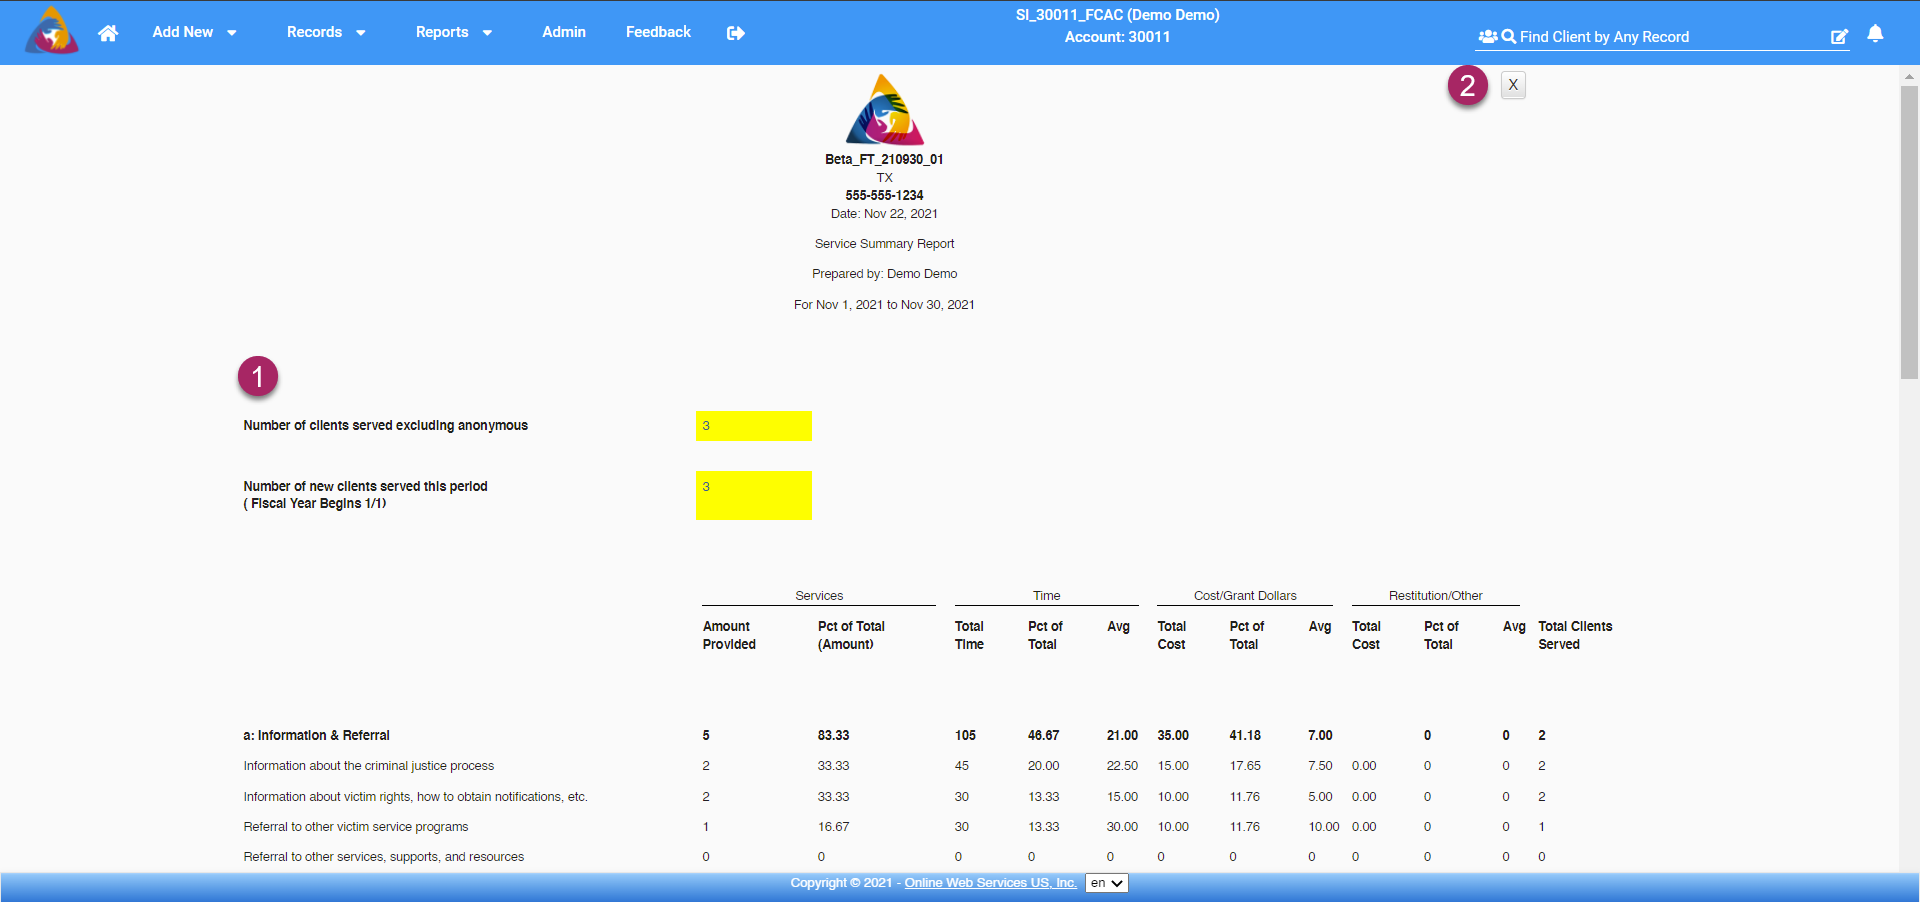
- The screen showing your report will have totals at the top of the page. In the table of data, totals will be shown in bold font. You can print this report by right-clicking anywhere on the screen and selecting print from the list of options. This will open your computer's print screen where you can select options for printing the report.
- To close the report, click the grey "X" button at the top right of the screen.
