What are Grant Reports?
Grant reports show data reported for your agency's grant over the course of your grant cycle.
Note: An administrator on your account will need to enable the Advanced Grant Manager Module before you can generate and view Grant Reports.
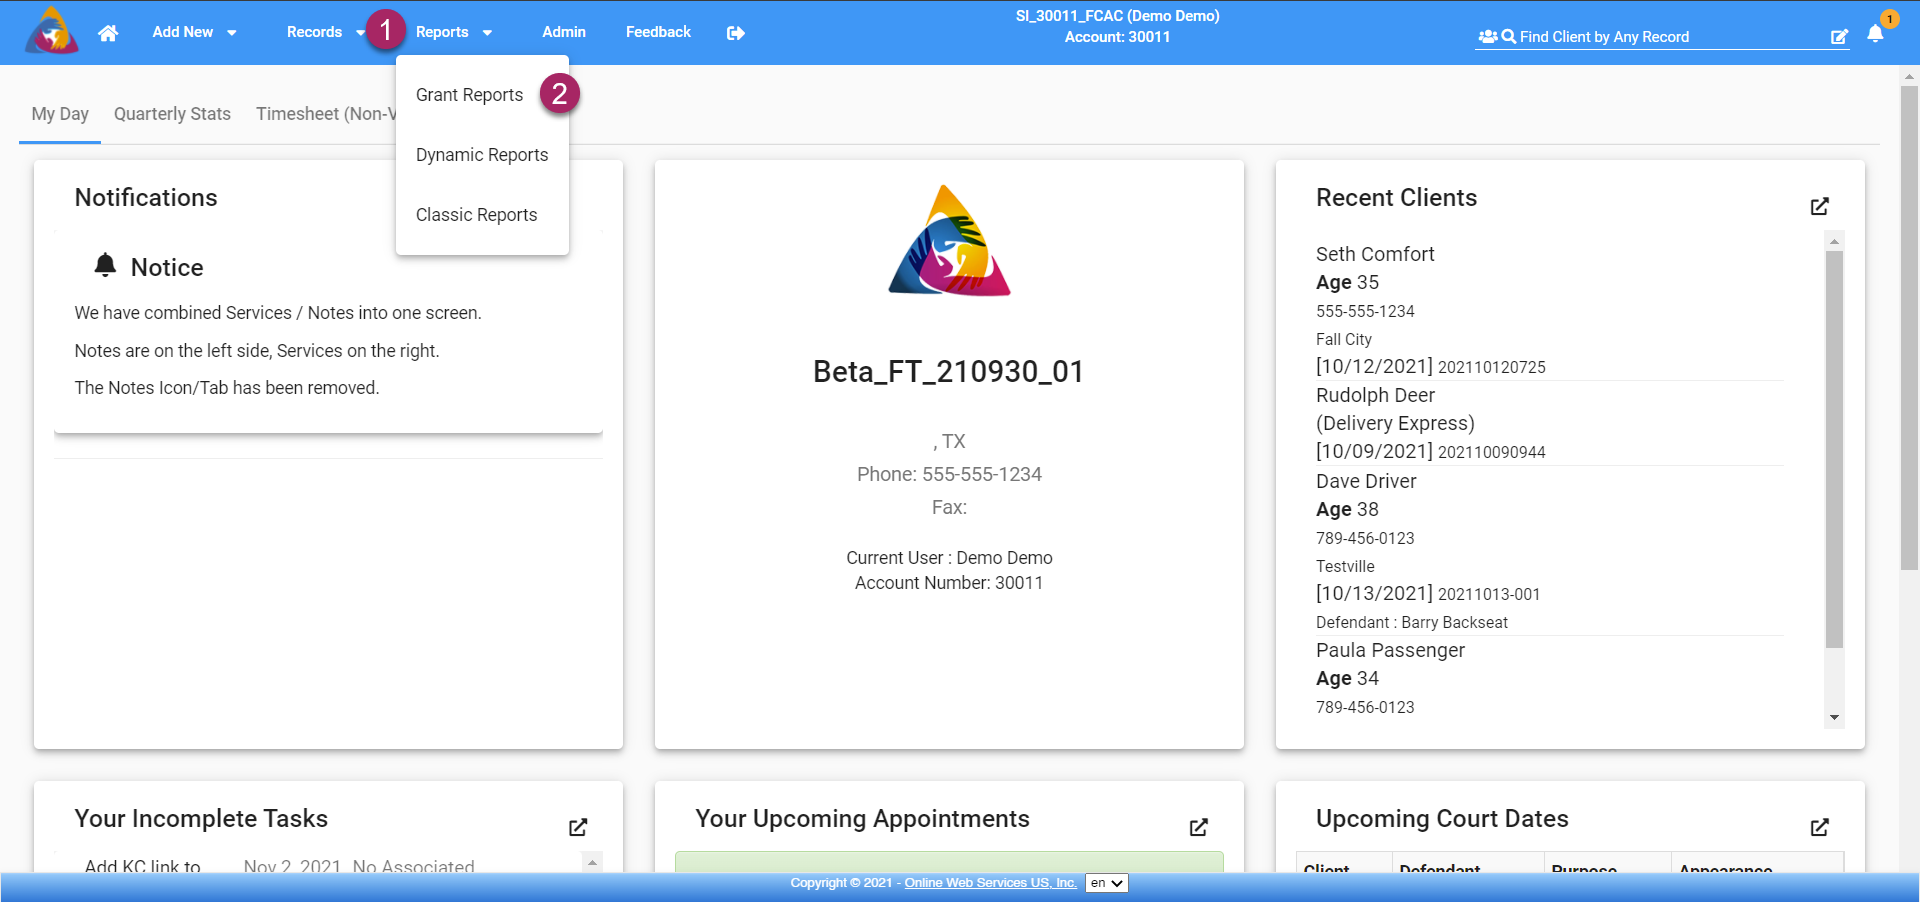
- From any screen in the software, click the reports dropdown on the top blue bar.
- Click on "Grant Reports" and you will be navigated to the Grant Reports screen.
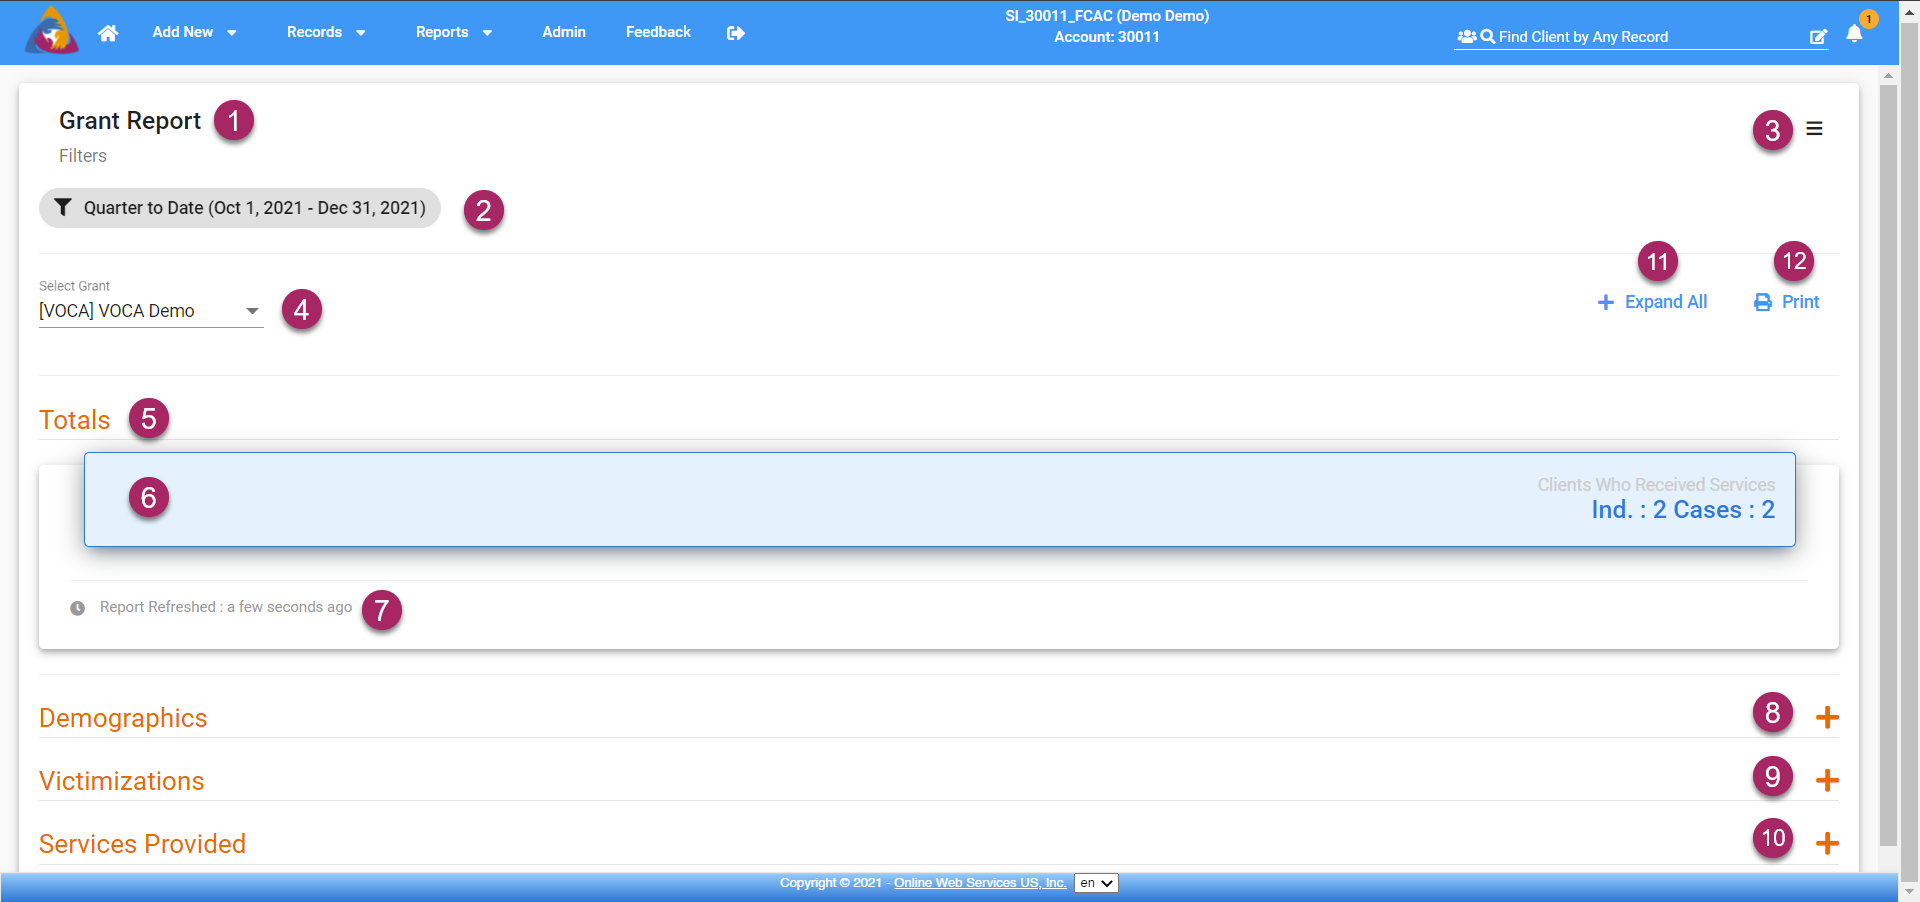
- Once on the Grant Reports screen, your screen will display a large block labeled "Grant Report"
- first, you will see a grey button with a funnel icon labeled "Quarter to Date". Clicking this allows you to change the period of time for which your grant will be generated.
- You can also adjust the filter settings by clicking the icon that looks like 3 bars in the top right corner of the block. Filtering your Report will be detailed further below in this article.
- In the dropdown field labeled "Select Grant", you are able to expand the dropdown by clicking on it. Doing so will show you a list of available grants and you can select one by clicking on it.
- Below the yellow header "Totals", you will see the totals for services.
- The blue block below "Totals" shows the total individuals that services were provided to as well as the total number of cases in which services were provided.
- Below the blue block, you will see small grey text that will tell you how recently the report was refreshed. Be sure to refresh the report to ensure the data shown is as current as possible. Options to refresh the report will be detailed further below in this article.
- Under the block showing Totals, you can view more specific information by expanding the tab labeled with the information you wish to view. View demographic info by clicking the yellow "+" icon on the right side of the tab labeled "Demographics"
- View Victimization info by clicking the yellow "+" icon on the right side of the tab labeled "Victimizations"
- View Services Provided info by clicking the yellow "+" icon on the right side of the tab labeled "Services Provided"
- All of the tabs can be expanded by clicking the blue button labeled "+ Expand All" at the top of the page.
- If you wish to print the report, click the blue "Print" button at the top of the page. This will open your computer's Print window where you can save the report as a pdf or send it to your printer.
Filtering Your Report - Basic Filters
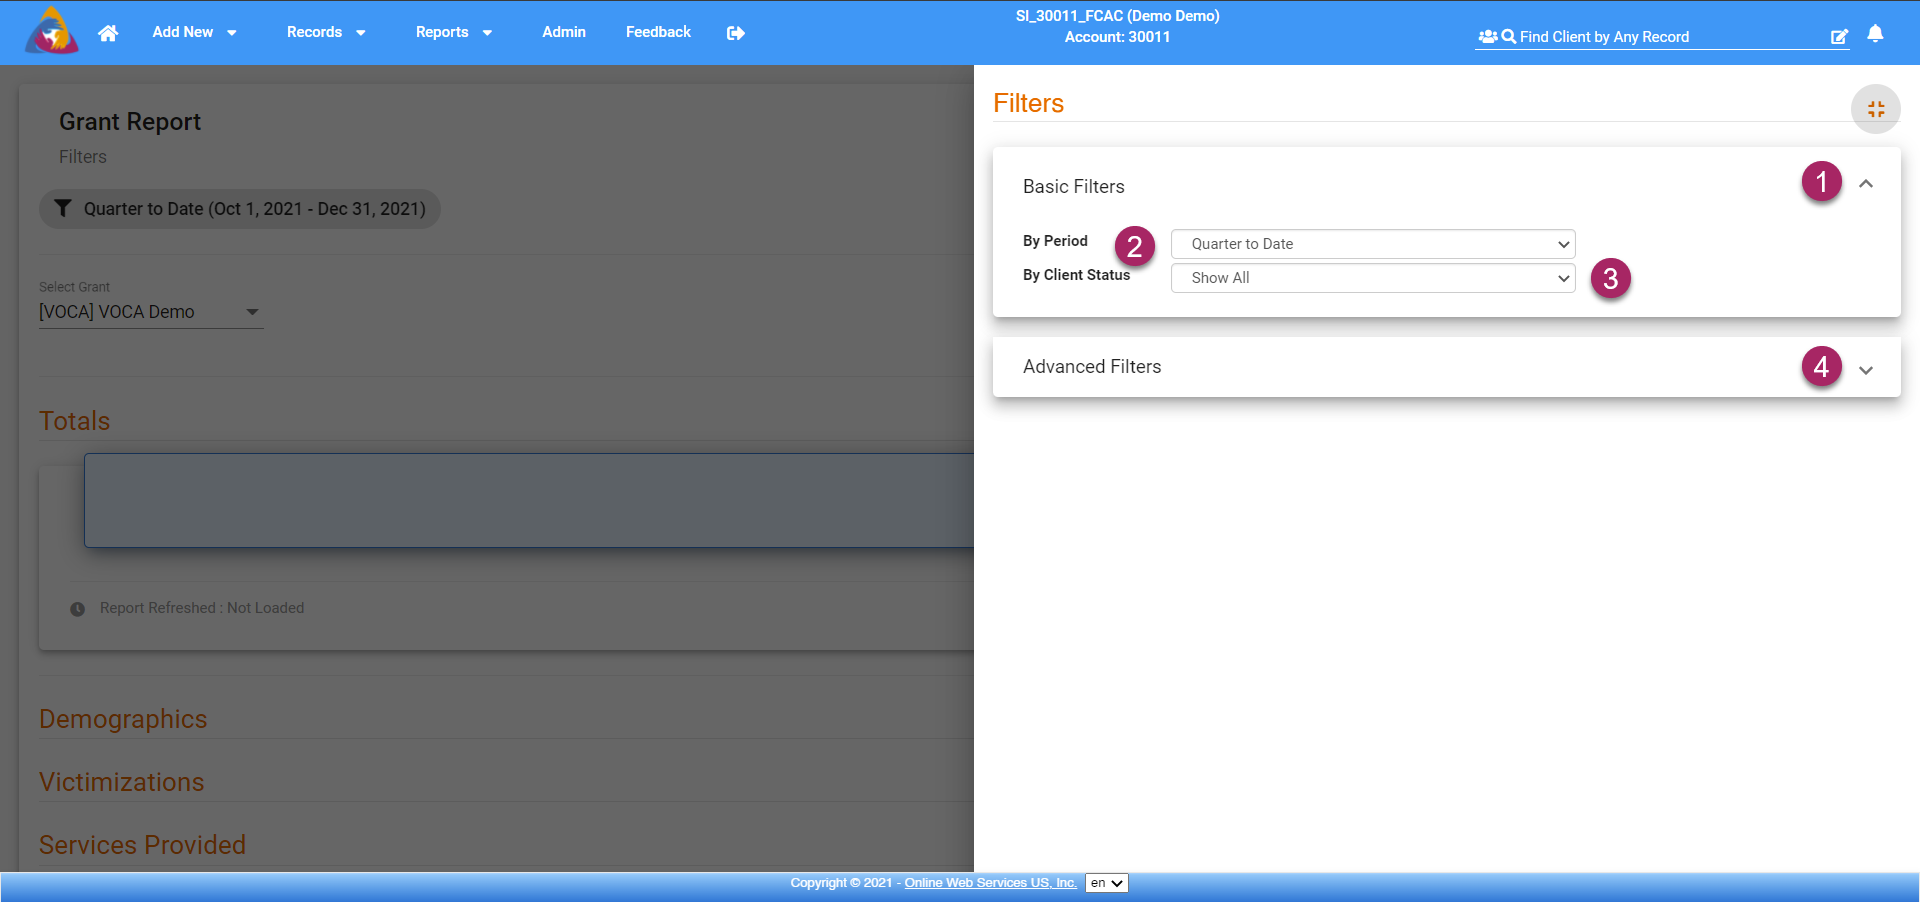
- After clicking either the grey "Quarter to Date" button or the icon that looks like 3 bars, a menu will open on the right side of the screen. Expand the dropdown labeled "Basic Filters" by clicking the arrow icon on the right side of its tab.
- Choose the period of time for which you want the report to show info by clicking the dropdown field to the right of "By Period".
- Choose to filter by client status in the dropdown field to the right of "By Client Status".
- To apply advanced filters click the arrow icon on the right side of the dropdown tab labeled "Advanced Filters". Applying advanced filters will be detailed below.
Filtering Your Report - Advanced Filters
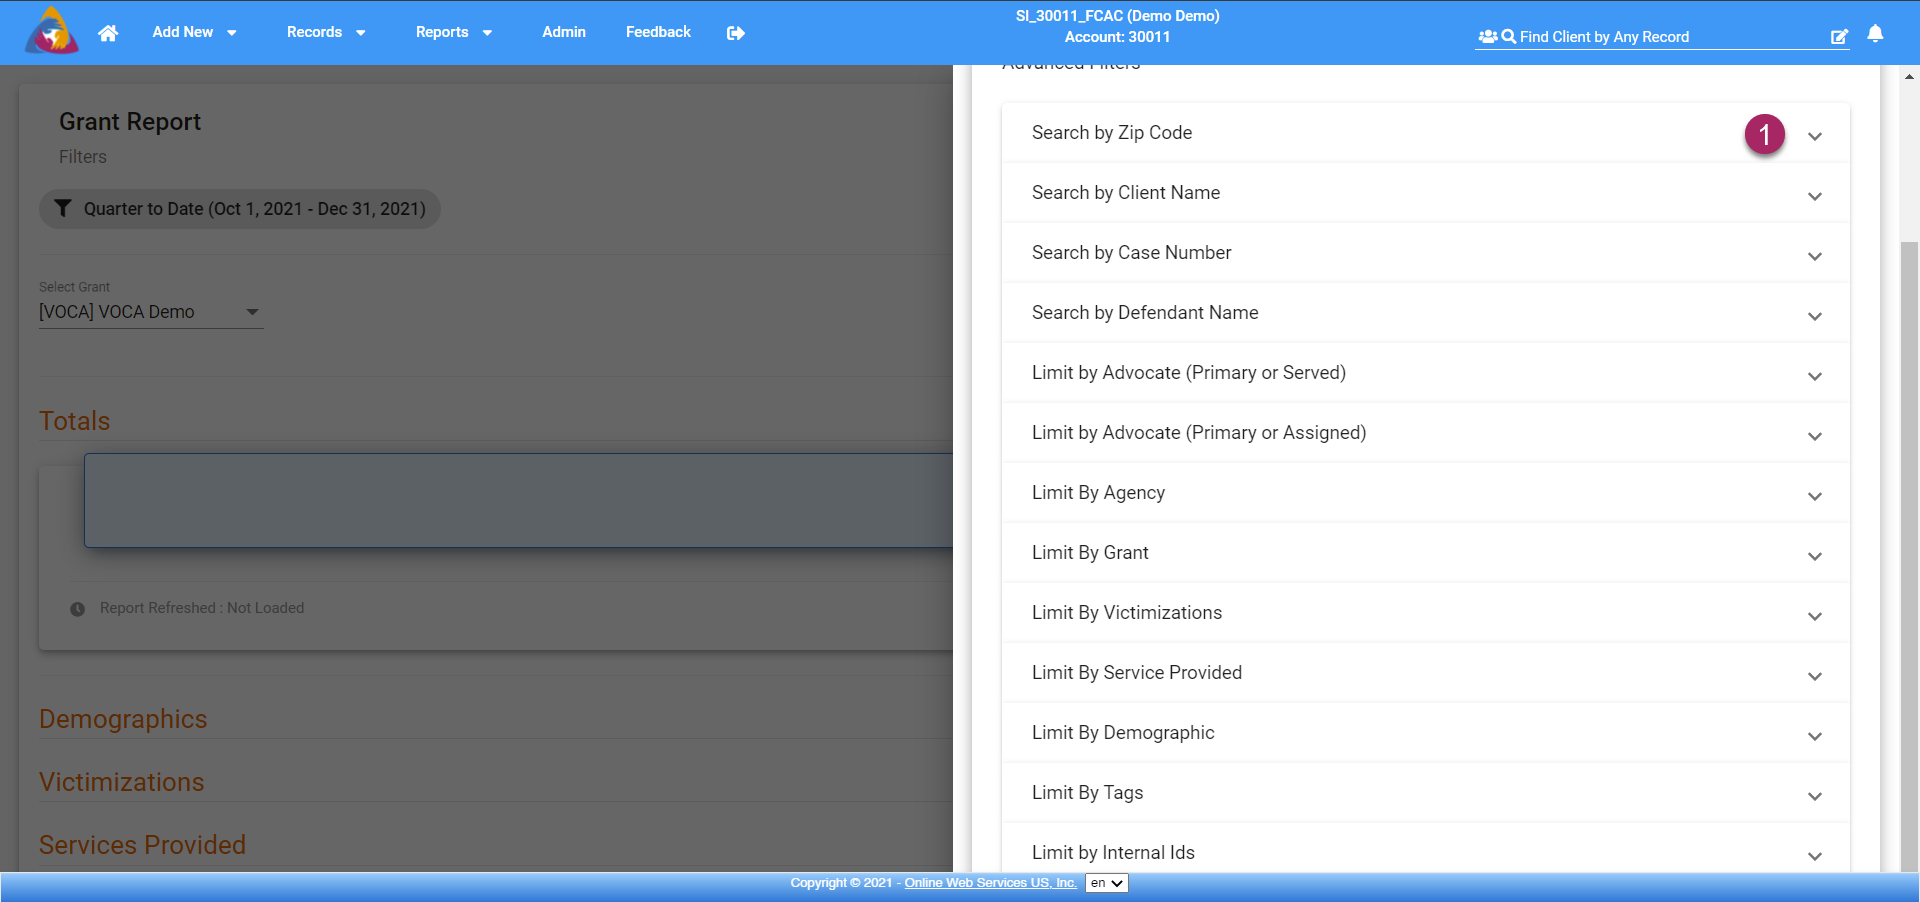
- A list of tabs for each advanced filter will be displayed when you expand the "Advanced Filters" tab. Click the arrow icon on the right side of any tab and you will be able to set options for that specific filter. Filters can be combined. To save and apply your filters, click on the left side of the screen and the side menu will be closed and your filters will be applied.
