
Full Service Reports allow you to generate reports based on all the services you have offered regardless if they are tied to a grant or not.
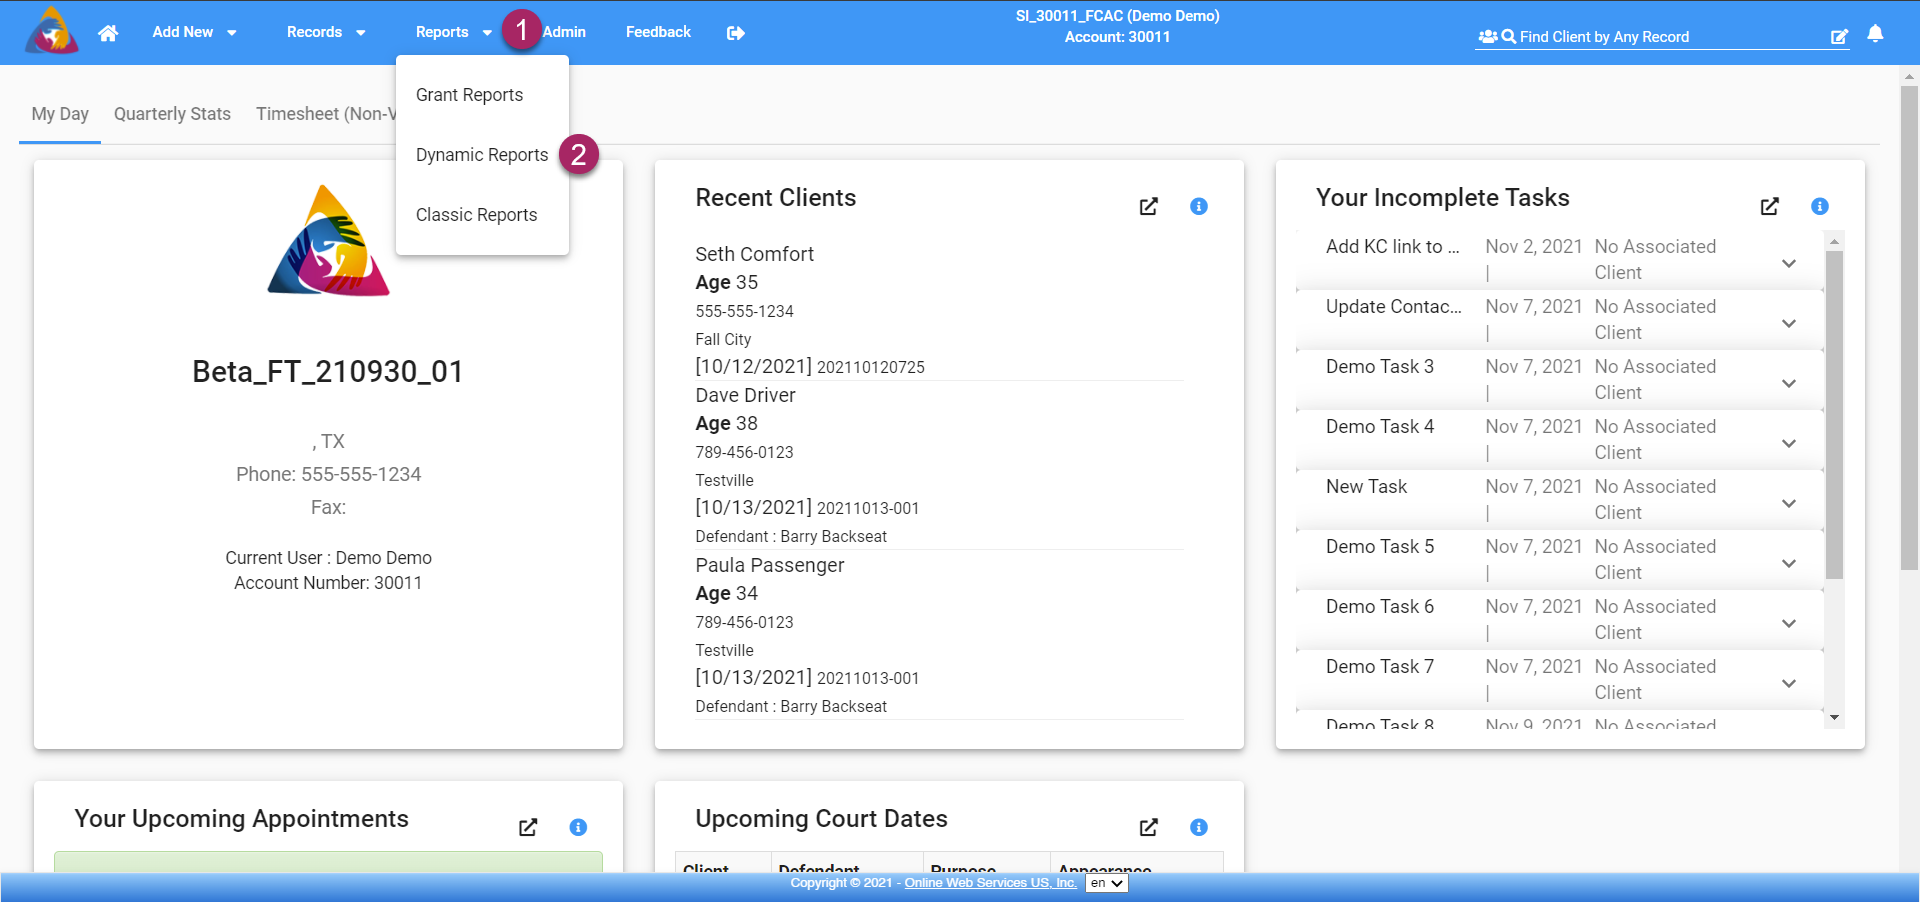
- To start, click on the "Reports" dropdown on the top blue bar.
- Select "Dynamic Reports" from the dropdown list.
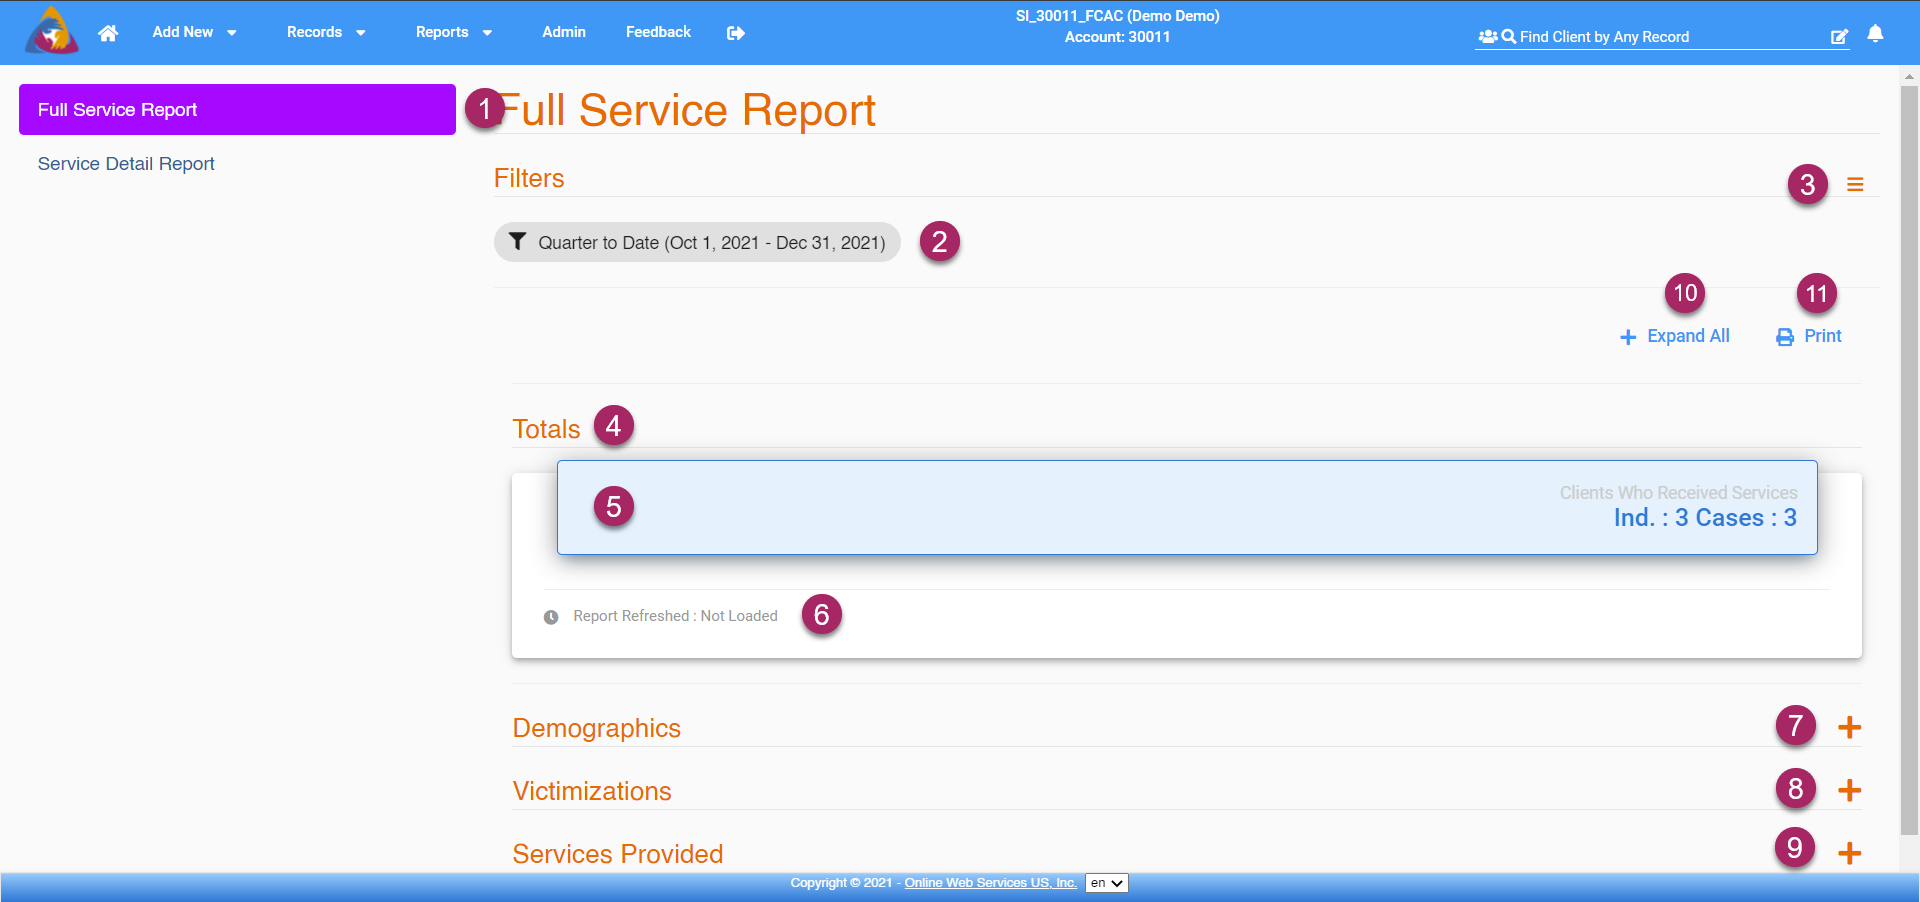
- Once on the Dynamic Reports screen, your screen will display a white screen with to tabs on the left side of the screen. Click on "Full Service Report" and the right side of the screen will show the Full Service Report.
- first, you will see a grey button with a funnel icon labeled "Quarter to Date". Clicking this allows you to change the period of time for which your grant will be generated.
- You can also adjust the filter settings by clicking the icon that looks like 3 bars in the top right corner of the block. Filtering your Report will be detailed further below in this article.
- Below the yellow header "Totals", you will see the totals for services.
- The blue block below "Totals" shows the total individuals that services were provided to as well as the total number of cases in which services were provided.
- Below the blue block, you will see small grey text that will tell you how recently the report was refreshed. Be sure to refresh the report to ensure the data shown is as current as possible. Options to refresh the report will be detailed further below in this article.
- Under the block showing Totals, you can view more specific information by expanding the tab labeled with the information you wish to view. View demographic info by clicking the yellow "+" icon on the right side of the tab labeled "Demographics"
- View Victimization info by clicking the yellow "+" icon on the right side of the tab labeled "Victimizations"
- View Services Provided info by clicking the yellow "+" icon on the right side of the tab labeled "Services Provided"
- All of the tabs can be expanded by clicking the blue button labeled "+ Expand All" at the top of the page.
- If you wish to print the report, click the blue "Print" button at the top of the page. This will open your computer's Print window where you can save the report as a pdf or send it to your printer.
Filter Your Report - Basic Filters
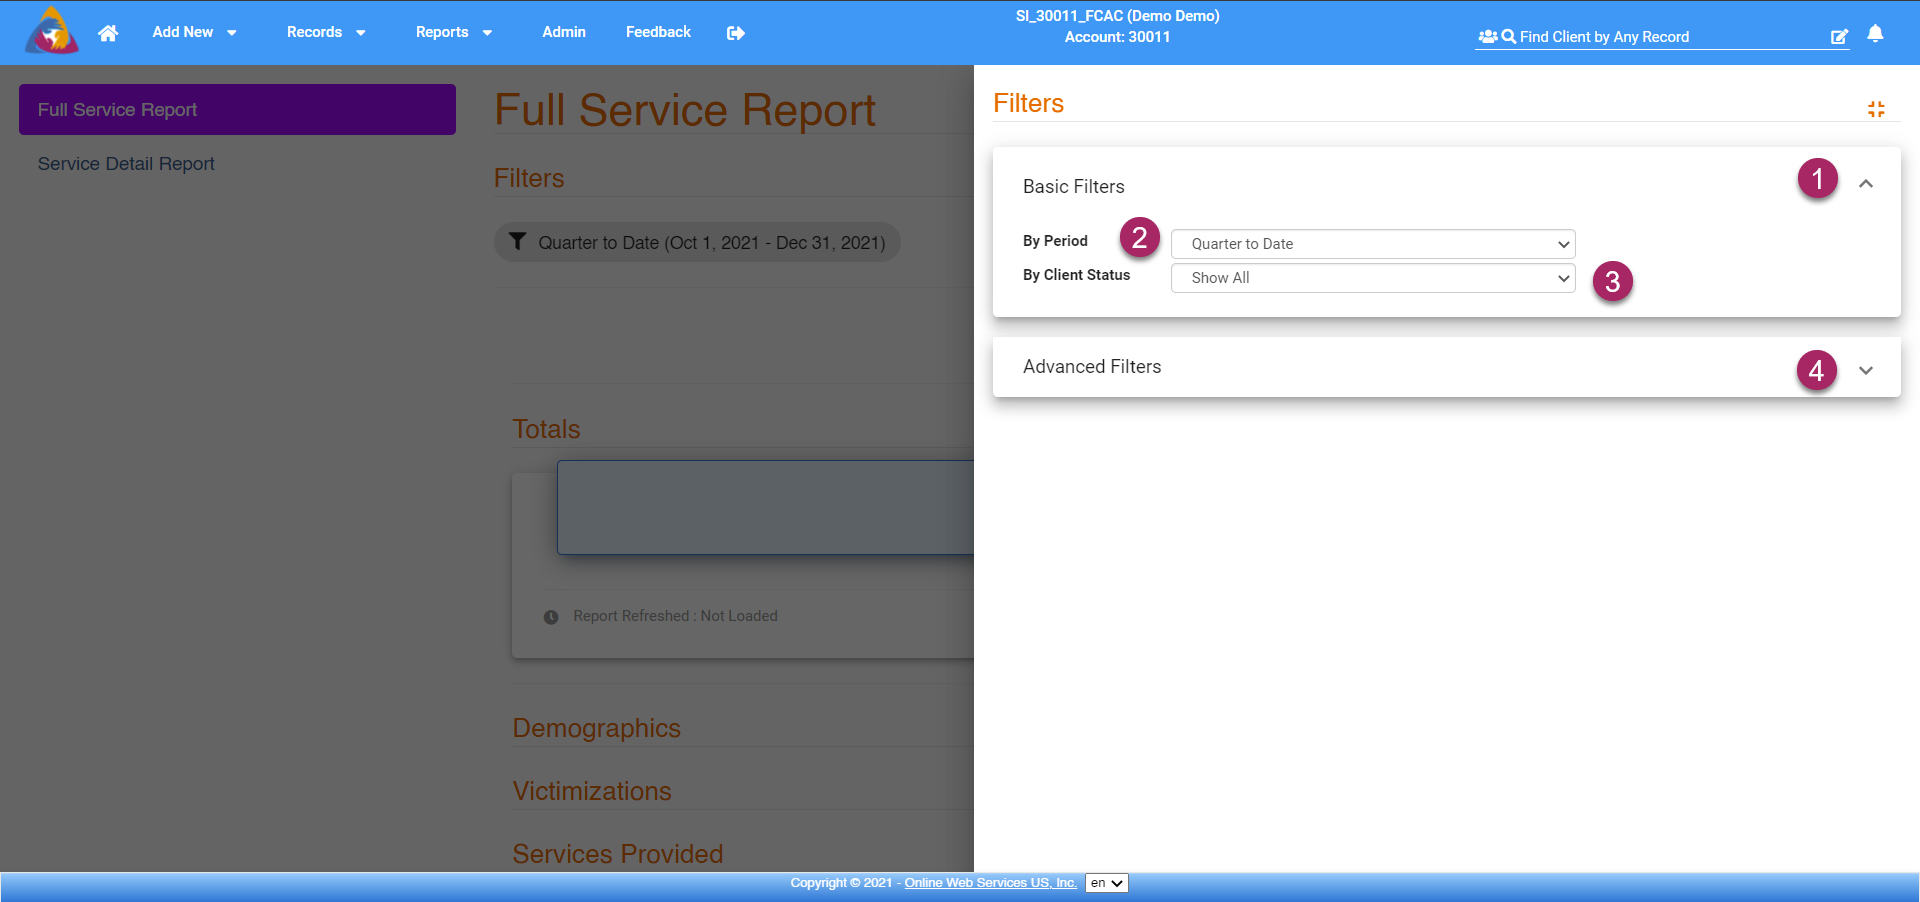
- After clicking either the grey "Quarter to Date" button or the icon that looks like 3 bars, a menu will open on the right side of the screen. Expand the dropdown labeled "Basic Filters" by clicking the arrow icon on the right side of its tab.
- Choose the period of time for which you want the report to show info by clicking the dropdown field to the right of "By Period".
- Choose to filter by client status in the dropdown field to the right of "By Client Status".
- To apply advanced filters click the arrow icon on the right side of the dropdown tab labeled "Advanced Filters". Applying advanced filters will be detailed below.
Filter Your Report - Advanced Filters
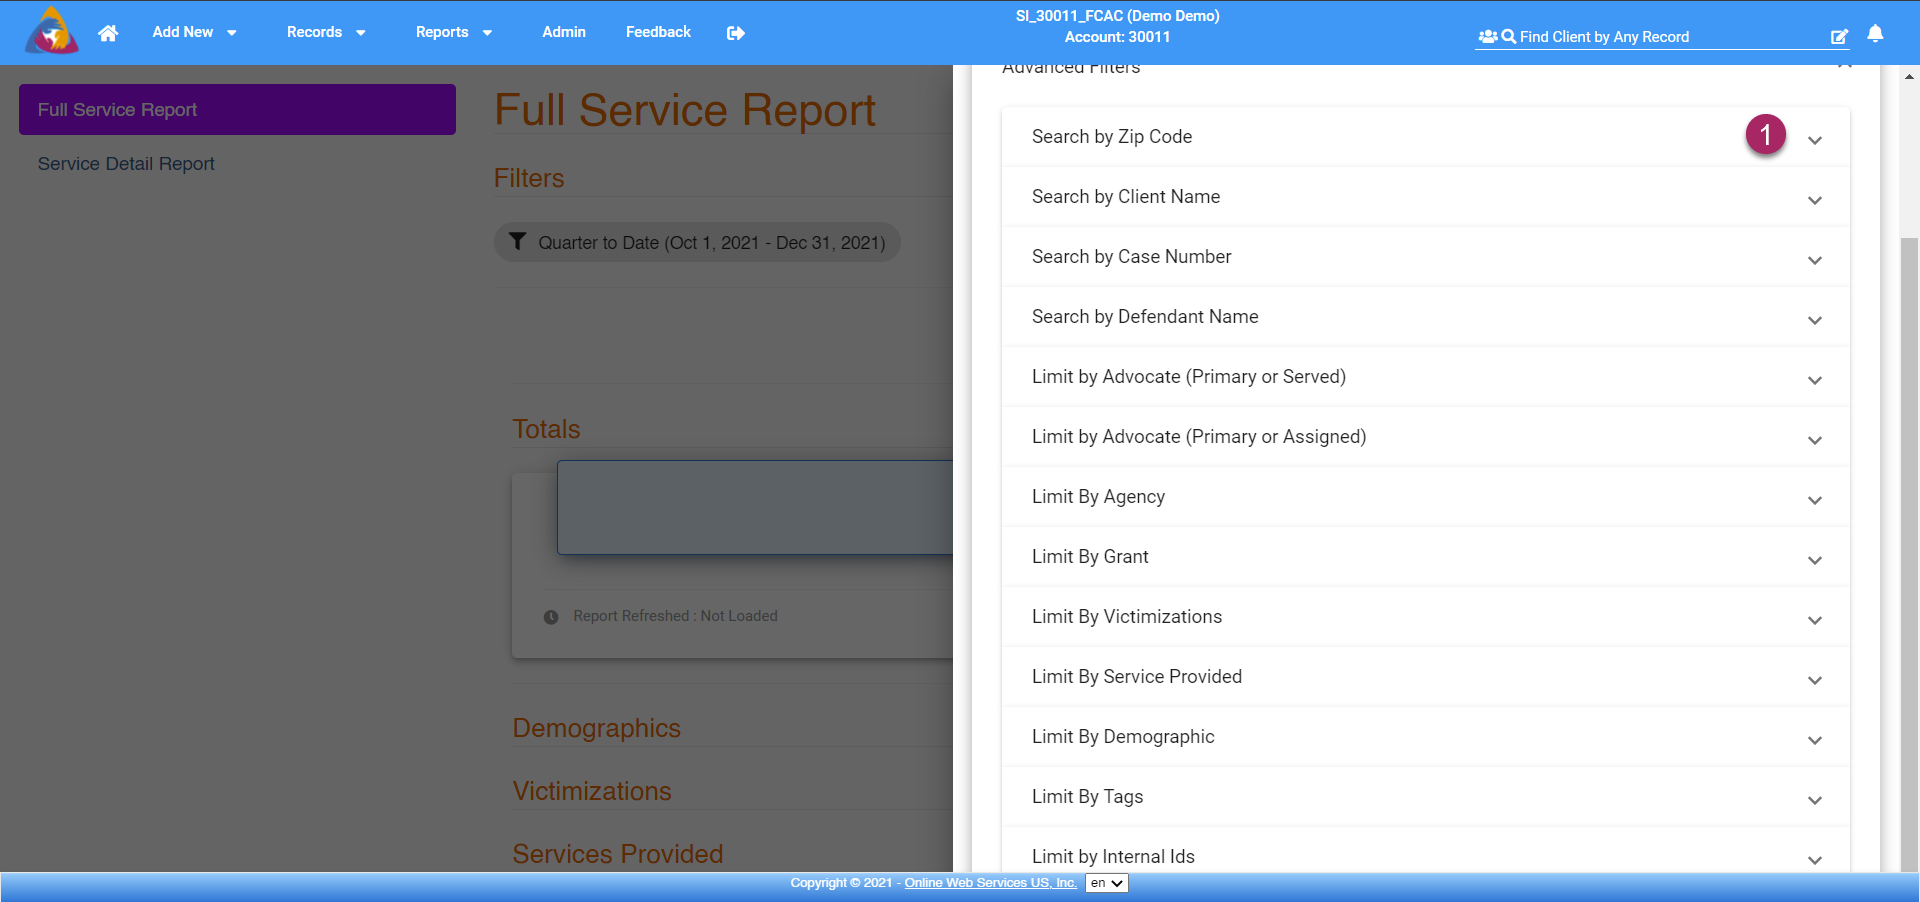
- A list of tabs for each advanced filter will be displayed when you expand the "Advanced Filters" tab. Click the arrow icon on the right side of any tab and you will be able to set options for that specific filter. Filters can be combined. To save and apply your filters, click on the left side of the screen and the side menu will be closed and your filters will be applied.
In each filter category you can choose what you would like your report to be 'narrowed down' by. If you do not put any check marks in any of the boxes in the categories all of the data will be included.
If you want to generate a report for 3 out of 5 of your Advocates, for instance, you can choose the three Advocates' names in those categories.
The Limit by Advocate (Primary or Served) will be the Advocate who is the Primary Advocate assigned to the client and ANY Advocates who provided a service to the client(s).
The Limit by Advocate (Primary or Assigned) will be the Advocate who is the Primary Advocate assigned to the client and ANY Advocates who have also been assigned.